
- Start >
- Rivers >
- Discharge >
- Oberer Main - Elbe >
- Friedersreuth >
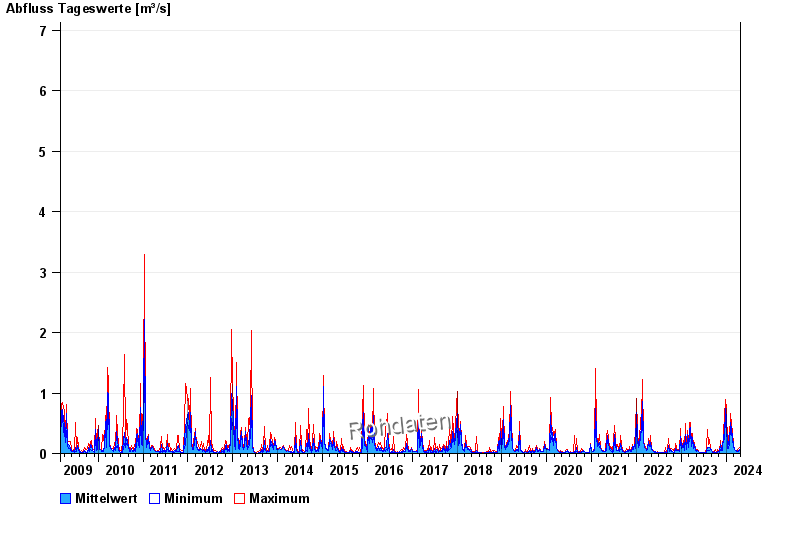
- Chart of total period

Chart of total period Friedersreuth / Schweinnaab
Discharge from 28.02.2009 to 26.04.2024
 Für diesen Pegel sind keine Jährlichkeiten hinterlegt.
| Date | Mean value [m³/s] | Maximum [m³/s] | Minimum [m³/s] |
|---|---|---|---|
| 26.04.2024 | 0.056 | 0.056 | 0.056 |
| 25.04.2024 | 0.053 | 0.056 | 0.05 |
| 24.04.2024 | 0.05 | 0.056 | 0.05 |
| 23.04.2024 | 0.055 | 0.069 | 0.05 |
| 22.04.2024 | 0.066 | 0.085 | 0.05 |
| 21.04.2024 | 0.062 | 0.094 | 0.041 |
| 20.04.2024 | 0.058 | 0.069 | 0.041 |
© Bayerisches Landesamt für Umwelt 2024