
- Start >
- Rivers >
- Discharge >
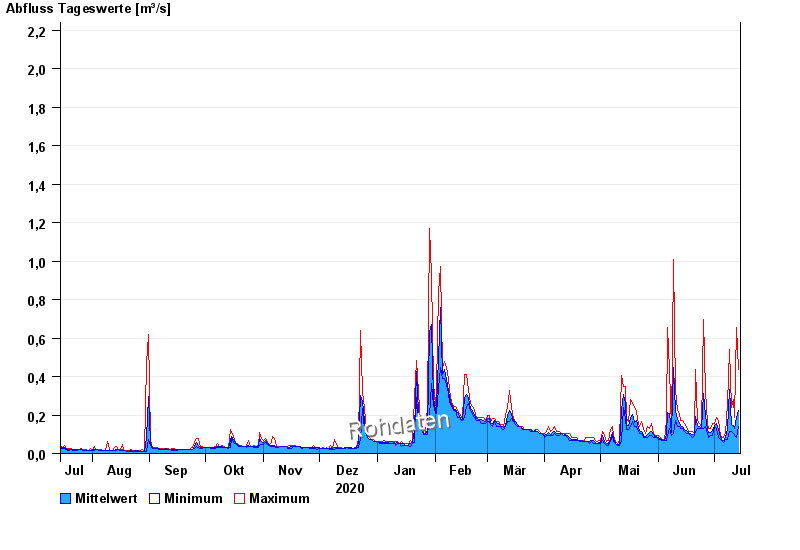
- Oberer Main - Elbe >
- Förmitz Speicherzufluss >
- Chart of year

Chart of year Förmitz Speicherzufluss / Förmitz
Discharge from 15.07.2020 to 14.07.2021
 Für diesen Pegel sind keine Jährlichkeiten hinterlegt.
| Date | Mean value [m³/s] | Maximum [m³/s] | Minimum [m³/s] |
|---|---|---|---|
| 14.07.2021 | 0.221 | 0.439 | 0.14 |
| 13.07.2021 | 0.189 | 0.655 | 0.084 |
| 12.07.2021 | 0.132 | 0.186 | 0.094 |
| 11.07.2021 | 0.145 | 0.282 | 0.104 |
| 10.07.2021 | 0.153 | 0.24 | 0.115 |
| 09.07.2021 | 0.333 | 0.54 | 0.115 |
| 08.07.2021 | 0.129 | 0.26 | 0.074 |
© Bayerisches Landesamt für Umwelt 2024