
- Start >
- Rivers >
- Discharge >
- Oberer Main - Elbe >
- Förmitz Speicherzufluss >
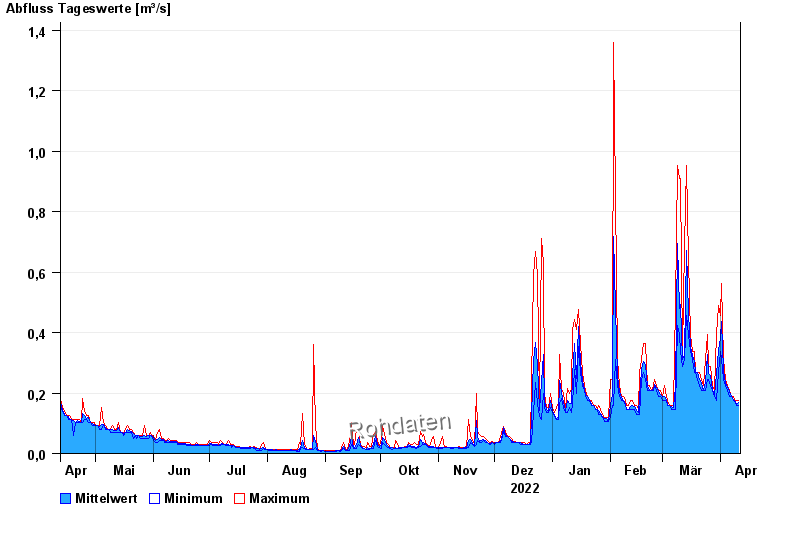
- Chart of year

Chart of year Förmitz Speicherzufluss / Förmitz
Discharge from 12.04.2022 to 11.04.2023
| Date | Mean value [m³/s] | Maximum [m³/s] | Minimum [m³/s] |
|---|---|---|---|
| 11.04.2023 | 0.169 | 0.174 | 0.158 |
| 10.04.2023 | 0.163 | 0.174 | 0.158 |
| 09.04.2023 | 0.174 | 0.174 | 0.174 |
| 08.04.2023 | 0.179 | 0.19 | 0.174 |
| 07.04.2023 | 0.19 | 0.19 | 0.19 |
| 06.04.2023 | 0.205 | 0.207 | 0.19 |
| 05.04.2023 | 0.217 | 0.226 | 0.207 |
© Bayerisches Landesamt für Umwelt 2024