
- Start >
- Rivers >
- Discharge >
- Oberer Main - Elbe >
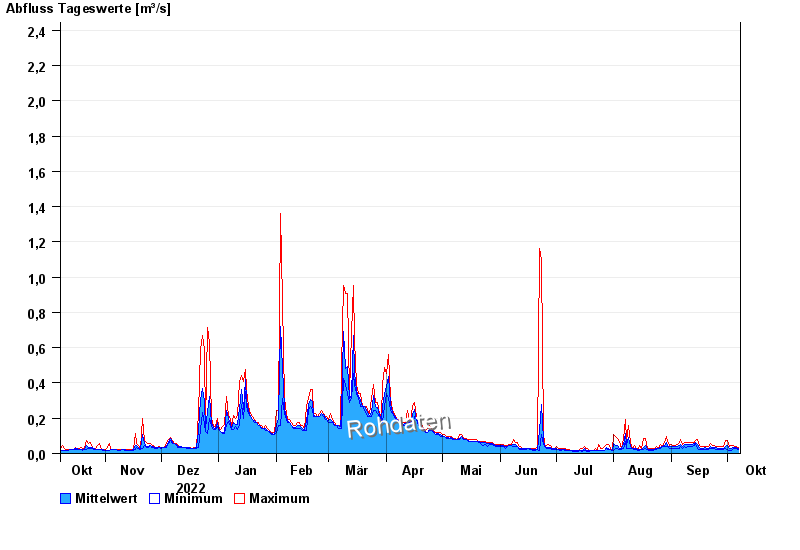
- Förmitz Speicherzufluss >
- Chart of year

Chart of year Förmitz Speicherzufluss / Förmitz
Discharge from 08.10.2022 to 07.10.2023
 Für diesen Pegel sind keine Jährlichkeiten hinterlegt.
| Date | Mean value [m³/s] | Maximum [m³/s] | Minimum [m³/s] |
|---|---|---|---|
| 07.10.2023 | 0.029 | 0.033 | 0.023 |
| 06.10.2023 | 0.033 | 0.039 | 0.028 |
| 05.10.2023 | 0.034 | 0.039 | 0.028 |
| 04.10.2023 | 0.035 | 0.047 | 0.028 |
| 03.10.2023 | 0.029 | 0.047 | 0.019 |
| 02.10.2023 | 0.027 | 0.039 | 0.019 |
| 01.10.2023 | 0.045 | 0.073 | 0.023 |
© Bayerisches Landesamt für Umwelt 2024