
- Start >
- Rivers >
- Discharge >
- Oberer Main - Elbe >
- Förmitz Speicherzufluss >
- Chart of year

Chart of year Förmitz Speicherzufluss / Förmitz
Discharge from 08.05.2021 to 07.05.2022
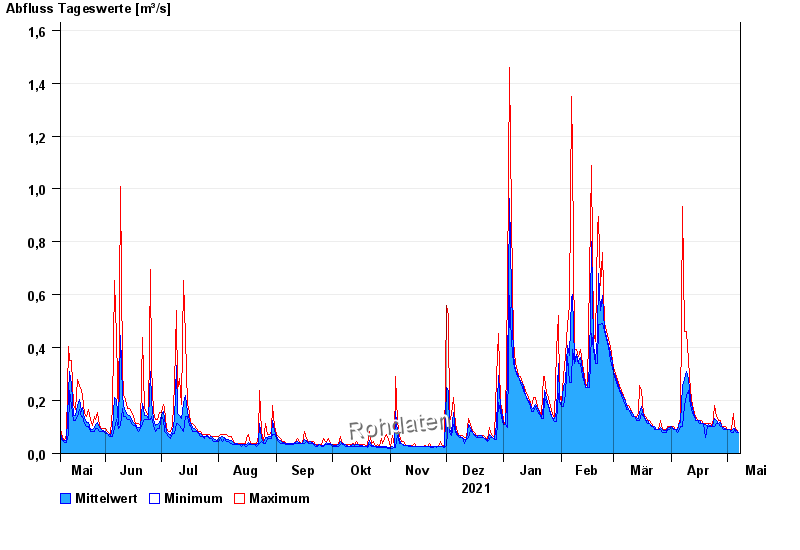
| Date | Mean value [m³/s] | Maximum [m³/s] | Minimum [m³/s] |
|---|---|---|---|
| 07.05.2022 | 0.081 | 0.081 | 0.081 |
| 06.05.2022 | 0.086 | 0.091 | 0.081 |
| 05.05.2022 | 0.096 | 0.102 | 0.091 |
| 04.05.2022 | 0.095 | 0.153 | 0.081 |
| 03.05.2022 | 0.089 | 0.091 | 0.081 |
| 02.05.2022 | 0.091 | 0.091 | 0.091 |
| 01.05.2022 | 0.091 | 0.091 | 0.091 |
© Bayerisches Landesamt für Umwelt 2024