
- Start >
- Rivers >
- Discharge >
- Oberer Main - Elbe >
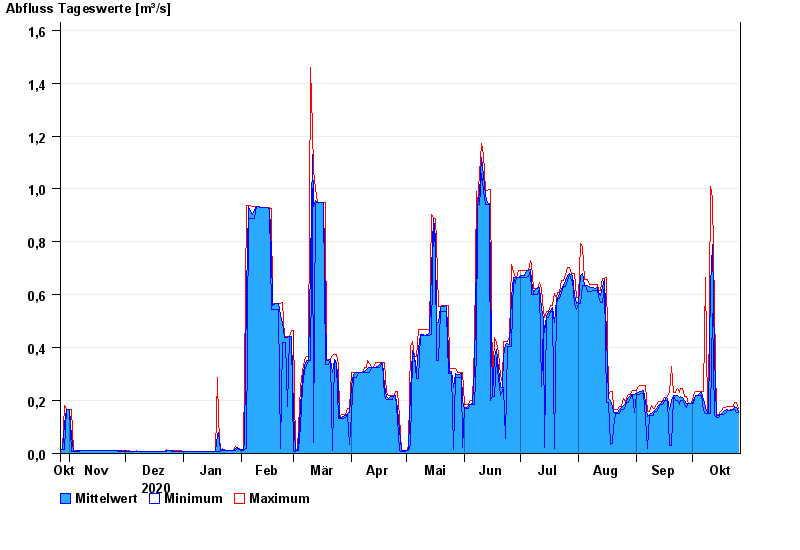
- Förmitz Speicherabfluss >
- Chart of year

Chart of year Förmitz Speicherabfluss / Förmitz
Discharge from 27.10.2020 to 26.10.2021
| Date | Mean value [m³/s] | Maximum [m³/s] | Minimum [m³/s] |
|---|---|---|---|
| 26.10.2021 | 0.157 | 0.169 | 0.156 |
| 25.10.2021 | 0.172 | 0.194 | 0.155 |
| 24.10.2021 | 0.176 | 0.194 | 0.166 |
| 23.10.2021 | 0.168 | 0.179 | 0.165 |
| 22.10.2021 | 0.167 | 0.178 | 0.164 |
| 21.10.2021 | 0.164 | 0.177 | 0.164 |
| 20.10.2021 | 0.166 | 0.176 | 0.163 |
© Bayerisches Landesamt für Umwelt 2024