
- Start >
- Rivers >
- Discharge >
- Oberer Main - Elbe >
- Fahrenbühl >
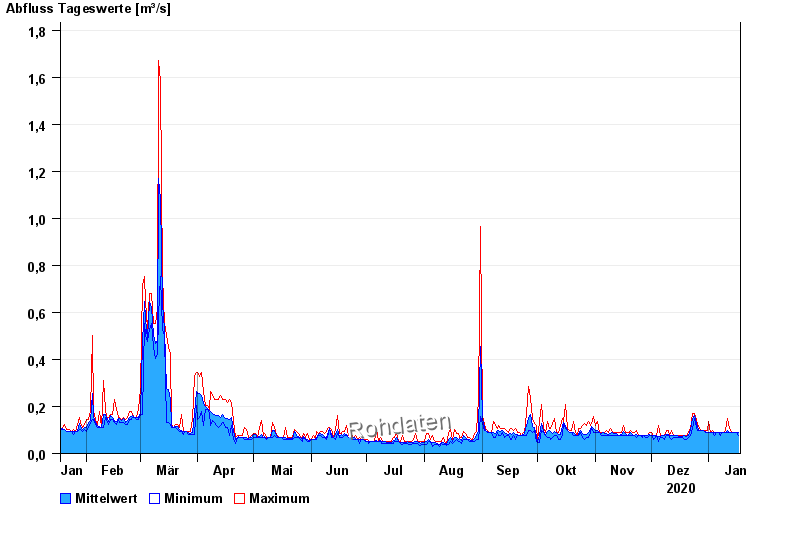
- Chart of year

Chart of year Fahrenbühl / Lamitz
Discharge from 18.01.2020 to 17.01.2021
note
Schlechte Netzanbindung
| Date | Mean value [m³/s] | Maximum [m³/s] | Minimum [m³/s] |
|---|---|---|---|
| 17.01.2021 | 0.087 | 0.088 | 0.078 |
| 16.01.2021 | 0.088 | 0.088 | 0.088 |
| 15.01.2021 | 0.088 | 0.088 | 0.088 |
| 14.01.2021 | 0.088 | 0.088 | 0.088 |
| 13.01.2021 | 0.088 | 0.088 | 0.088 |
| 12.01.2021 | 0.09 | 0.107 | 0.088 |
| 11.01.2021 | 0.098 | 0.148 | 0.088 |
© Bayerisches Landesamt für Umwelt 2024