
- Start >
- Rivers >
- Discharge >
- Oberer Main - Elbe >
- Fahrenbühl >
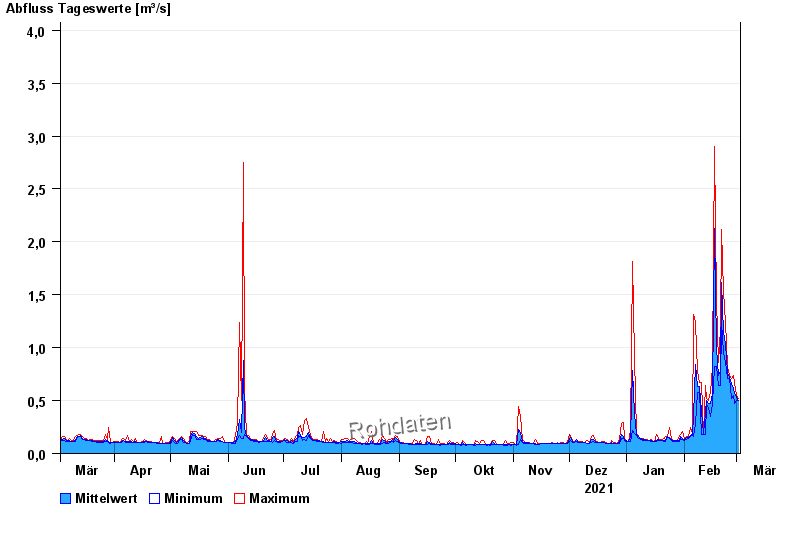
- Chart of year

Chart of year Fahrenbühl / Lamitz
Discharge from 03.03.2021 to 02.03.2022
note
Schlechte Netzanbindung
- 07.02.1984 Abfluss: 9,47 m³/s
- 23.01.1995 Abfluss: 8,61 m³/s
- 26.12.1974 Abfluss: 8,55 m³/s
- 04.08.1969 Abfluss: 8,35 m³/s
- 12.02.2005 Abfluss: 7,97 m³/s
| Date | Mean value [m³/s] | Maximum [m³/s] | Minimum [m³/s] |
|---|---|---|---|
| 02.03.2022 | 0.503 | 0.523 | 0.497 |
| 01.03.2022 | 0.528 | 0.548 | 0.497 |
| 28.02.2022 | 0.564 | 0.672 | 0.472 |
| 27.02.2022 | 0.613 | 0.741 | 0.548 |
| 26.02.2022 | 0.662 | 0.705 | 0.523 |
| 25.02.2022 | 0.717 | 0.741 | 0.705 |
| 24.02.2022 | 0.762 | 0.819 | 0.705 |
© Bayerisches Landesamt für Umwelt 2024