
- Start >
- Rivers >
- Discharge >
- Oberer Main - Elbe >
- Erbendorf >
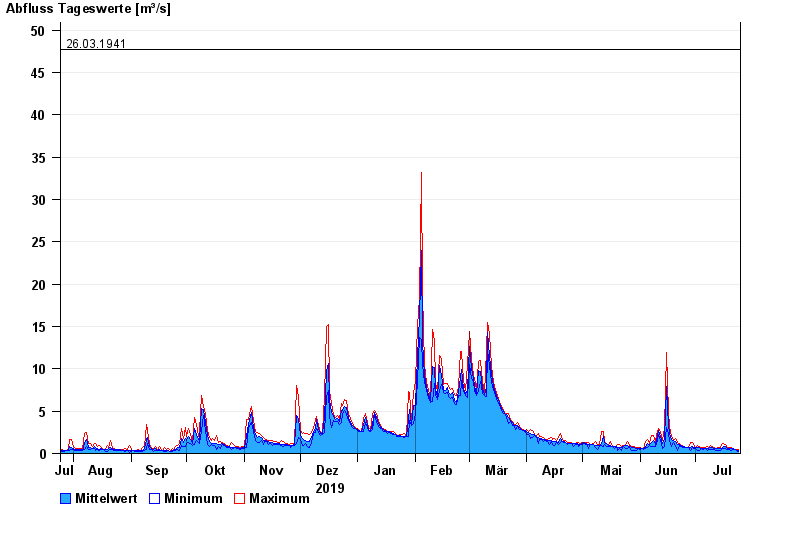
- Chart of year

Chart of year Erbendorf / Fichtelnaab
Discharge from 25.07.2019 to 24.07.2020
- 28.12.1947 Abfluss: 69,5 m³/s
- 11.07.1954 Abfluss: 63,6 m³/s
- 08.02.1946 Abfluss: 54,9 m³/s
- 12.03.1947 Abfluss: 50,4 m³/s
- 26.03.1941 Abfluss: 47,7 m³/s
| Date | Mean value [m³/s] | Maximum [m³/s] | Minimum [m³/s] |
|---|---|---|---|
| 24.07.2020 | 0.371 | 0.451 | 0.282 |
| 23.07.2020 | 0.408 | 0.457 | 0.311 |
| 22.07.2020 | 0.494 | 0.53 | 0.457 |
| 21.07.2020 | 0.533 | 0.577 | 0.443 |
| 20.07.2020 | 0.6 | 0.748 | 0.368 |
| 19.07.2020 | 0.598 | 0.68 | 0.49 |
| 18.07.2020 | 0.638 | 0.72 | 0.449 |
© Bayerisches Landesamt für Umwelt 2024