
- Start >
- Rivers >
- Discharge >
- Oberer Main - Elbe >
- Erbendorf >
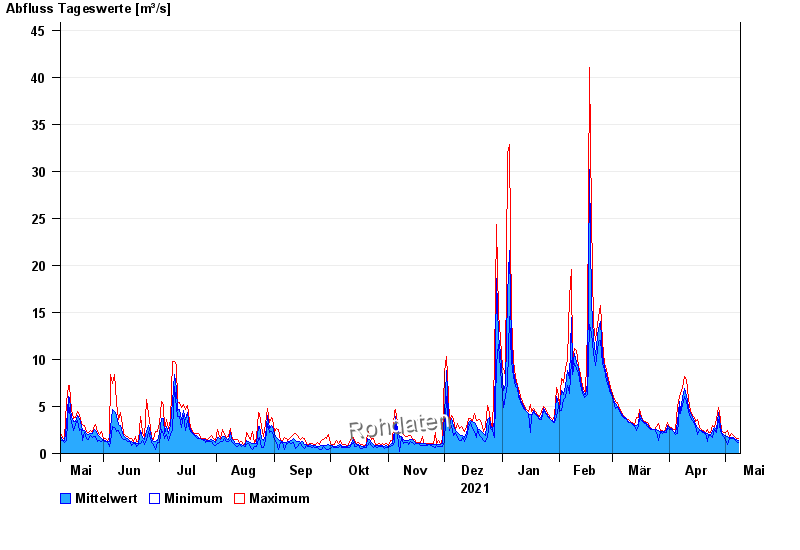
- Chart of year

Chart of year Erbendorf / Fichtelnaab
Discharge from 09.05.2021 to 08.05.2022
| Date | Mean value [m³/s] | Maximum [m³/s] | Minimum [m³/s] |
|---|---|---|---|
| 08.05.2022 | 1.37 | 1.6 | 1.22 |
| 07.05.2022 | 1.45 | 1.6 | 1.29 |
| 06.05.2022 | 1.59 | 1.84 | 1.52 |
| 05.05.2022 | 1.67 | 1.93 | 1.6 |
| 04.05.2022 | 1.75 | 2.09 | 1.6 |
| 03.05.2022 | 1.68 | 1.84 | 1.6 |
| 02.05.2022 | 1.77 | 2.45 | 0.943 |
© Bayerisches Landesamt für Umwelt 2024