
- Start >
- Rivers >
- Discharge >
- Oberer Main - Elbe >
- Erbendorf >
- Chart of year

Chart of year Erbendorf / Fichtelnaab
Discharge from 07.03.2021 to 06.03.2022
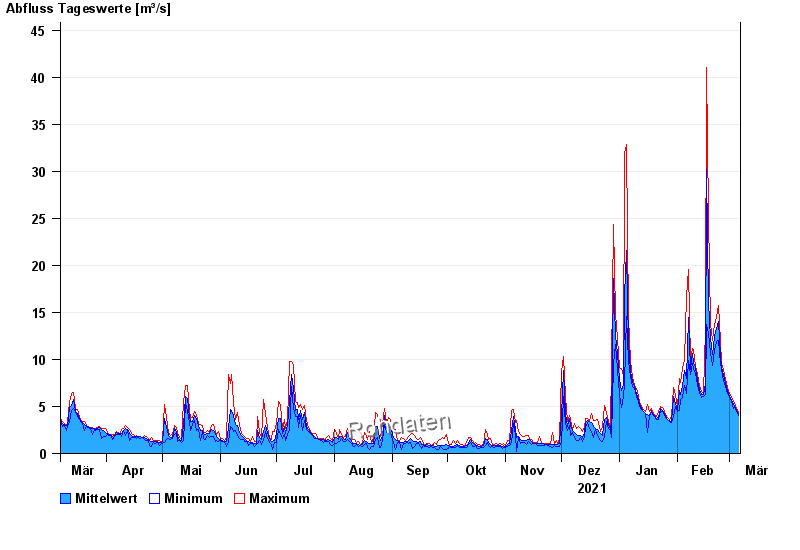
| Date | Mean value [m³/s] | Maximum [m³/s] | Minimum [m³/s] |
|---|---|---|---|
| 06.03.2022 | 4.22 | 4.41 | 4.09 |
| 05.03.2022 | 4.57 | 4.74 | 4.42 |
| 04.03.2022 | 4.99 | 5.44 | 4.88 |
| 03.03.2022 | 5.28 | 5.55 | 4.77 |
| 02.03.2022 | 5.64 | 5.91 | 5.55 |
| 01.03.2022 | 6.05 | 6.38 | 5.91 |
| 28.02.2022 | 6.68 | 7 | 6.38 |
© Bayerisches Landesamt für Umwelt 2024