
- Start >
- Rivers >
- Discharge >
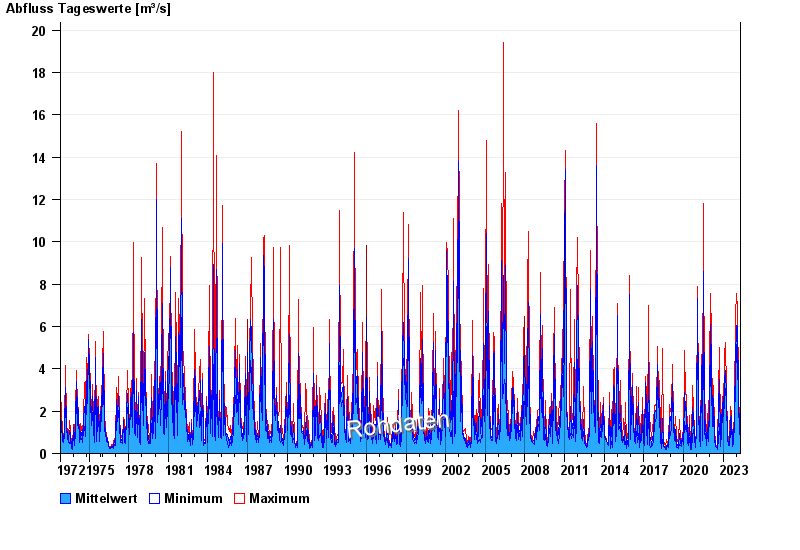
- Oberer Main - Elbe >
- Dobrigau >
- Chart of total period

Chart of total period Dobrigau / Wondreb
Discharge from 01.11.1972 to 26.04.2024
| Date | Mean value [m³/s] | Maximum [m³/s] | Minimum [m³/s] |
|---|---|---|---|
| 26.04.2024 | 0.97 | 1.01 | 0.908 |
| 25.04.2024 | 0.938 | 1.01 | 0.908 |
| 24.04.2024 | 0.991 | 1.04 | 0.935 |
| 23.04.2024 | 1.19 | 1.34 | 1.04 |
| 22.04.2024 | 1.44 | 1.65 | 1.28 |
| 21.04.2024 | 1.13 | 1.52 | 0.963 |
| 20.04.2024 | 0.986 | 1.13 | 0.804 |
© Bayerisches Landesamt für Umwelt 2024