
- Start >
- Rivers >
- Discharge >
- Oberer Main - Elbe >
- Creußen >
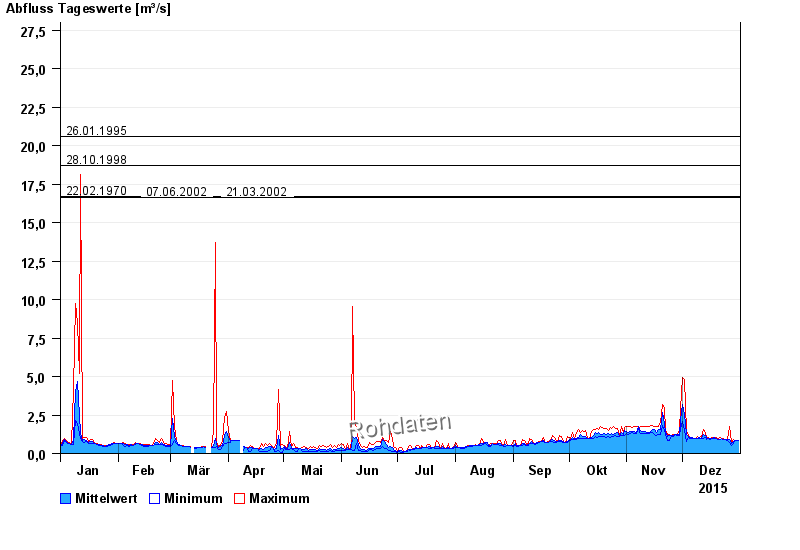
- Chart of year

Chart of year Creußen / Roter Main
Discharge from 01.01.2015 to 31.12.2015
note
Aufstau durch Biberdamm
Übertragung gestört
- 26.01.1995 Abfluss: 20,6 m³/s
- 28.10.1998 Abfluss: 18,7 m³/s
- 22.02.1970 Abfluss: 16,7 m³/s
- 07.06.2002 Abfluss: 16,6 m³/s
- 21.03.2002 Abfluss: 16,6 m³/s
| Date | Mean value [m³/s] | Maximum [m³/s] | Minimum [m³/s] |
|---|---|---|---|
| 31.12.2015 | 0.857 | 0.877 | 0.854 |
| 30.12.2015 | 0.854 | 0.854 | 0.854 |
| 29.12.2015 | 0.86 | 0.877 | 0.854 |
| 28.12.2015 | 0.808 | 0.899 | 0.638 |
| 27.12.2015 | 0.663 | 0.743 | 0.518 |
| 26.12.2015 | 0.894 | 1.77 | 0.743 |
| 25.12.2015 | 0.889 | 0.899 | 0.854 |
© Bayerisches Landesamt für Umwelt 2024