
- Start >
- Rivers >
- Discharge >
- Oberer Main - Elbe >
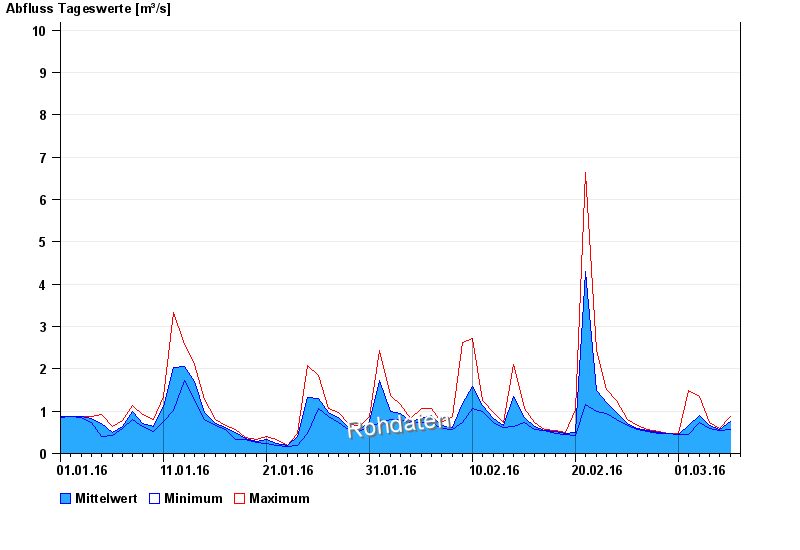
- Creußen >
- Chart of year

Chart of year Creußen / Roter Main
Discharge from 01.01.2016 to 06.03.2016
note
Aufstau durch Biberdamm
Übertragung gestört
- 26.01.1995 Abfluss: 20,6 m³/s
- 28.10.1998 Abfluss: 18,7 m³/s
- 22.02.1970 Abfluss: 16,7 m³/s
- 07.06.2002 Abfluss: 16,6 m³/s
- 21.03.2002 Abfluss: 16,6 m³/s
| Date | Mean value [m³/s] | Maximum [m³/s] | Minimum [m³/s] |
|---|---|---|---|
| 06.03.2016 | 0.754 | 0.877 | 0.578 |
| 05.03.2016 | 0.56 | 0.597 | 0.538 |
| 04.03.2016 | 0.65 | 0.743 | 0.597 |
| 03.03.2016 | 0.906 | 1.35 | 0.743 |
| 02.03.2016 | 0.669 | 1.49 | 0.443 |
| 01.03.2016 | 0.452 | 0.461 | 0.443 |
| 29.02.2016 | 0.466 | 0.48 | 0.461 |
© Bayerisches Landesamt für Umwelt 2024