
- Start >
- Rivers >
- Discharge >
- Oberer Main - Elbe >
- Coburg >
- Chart of year

Chart of year Coburg / Itz
Discharge from 04.03.2024 to 03.03.2025
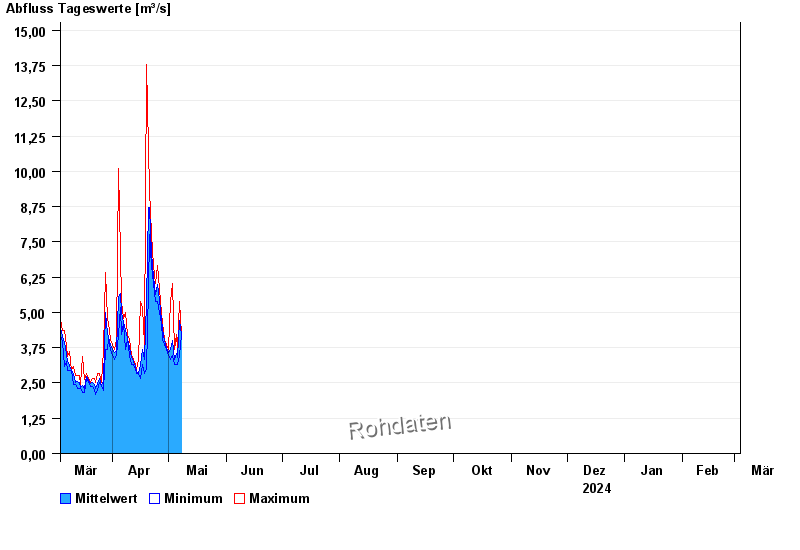
| Date | Mean value [m³/s] | Maximum [m³/s] | Minimum [m³/s] |
|---|---|---|---|
| 26.04.2024 | 5.45 | 5.8 | 4.99 |
| 25.04.2024 | 5.99 | 6.66 | 5.39 |
| 24.04.2024 | 5.62 | 6.01 | 5.39 |
| 23.04.2024 | 6.27 | 6.66 | 6.01 |
| 22.04.2024 | 7.1 | 7.75 | 6.66 |
| 21.04.2024 | 8.73 | 9.34 | 7.75 |
| 20.04.2024 | 8.73 | 10.8 | 5.8 |
© Bayerisches Landesamt für Umwelt 2024