
- Start >
- Rivers >
- Discharge >
- Oberer Main - Elbe >
- Coburg >
- Chart of month

Chart of month Coburg / Itz
Discharge from 01.01.2022 to 31.01.2022
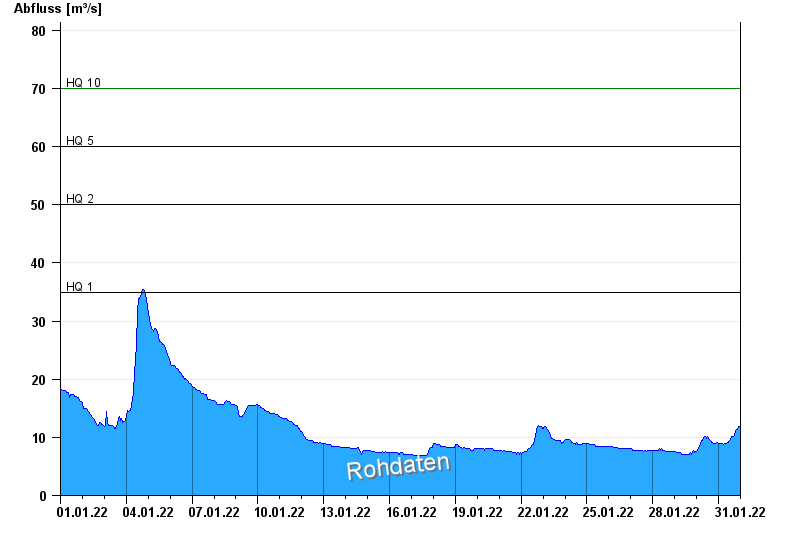
- HQ1 35 m³/s
- HQ2 50 m³/s
- HQ5 60 m³/s
- HQ10 70 m³/s
- HQ20 82 m³/s
- HQ50 95 m³/s
- HQ100 110 m³/s
| Date | Runoff [m³/s] |
|---|---|
| 31.01.2022 23:45 | 11.5 |
| 31.01.2022 23:30 | 11.5 |
| 31.01.2022 23:15 | 11.5 |
| 31.01.2022 23:00 | 11.8 |
| 31.01.2022 22:45 | 11.5 |
| 31.01.2022 22:30 | 11.5 |
| 31.01.2022 22:15 | 11.3 |
© Bayerisches Landesamt für Umwelt 2024