
- Start >
- Rivers >
- Discharge >
- Oberer Main - Elbe >
- Behringersmühle >
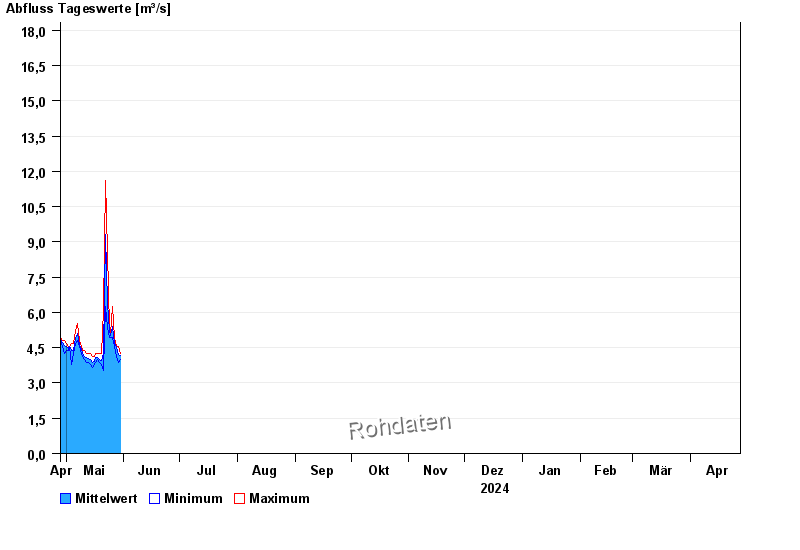
- Chart of year

Chart of year Behringersmühle / Wiesent
Discharge from 28.04.2024 to 27.04.2025
- 14.01.2011 Abfluss: 28,2 m³/s
- 03.06.2013 Abfluss: 26,3 m³/s
- 27.08.2010 Abfluss: 25,9 m³/s
- 23.12.2012 Abfluss: 25,3 m³/s
- 28.05.2006 Abfluss: 22,4 m³/s
| Date | Mean value [m³/s] | Maximum [m³/s] | Minimum [m³/s] |
|---|---|---|---|
| 20.05.2024 | 3.97 | 4.27 | 3.89 |
| 19.05.2024 | 4.01 | 4.27 | 3.89 |
| 18.05.2024 | 4.1 | 4.27 | 4.01 |
| 17.05.2024 | 4.09 | 4.27 | 3.89 |
| 16.05.2024 | 3.91 | 4.14 | 3.77 |
| 15.05.2024 | 3.89 | 4.14 | 3.64 |
| 14.05.2024 | 3.98 | 4.27 | 3.77 |
© Bayerisches Landesamt für Umwelt 2024