
- Start >
- Rivers >
- Discharge >
- Oberer Main - Elbe >
- Bayreuth >
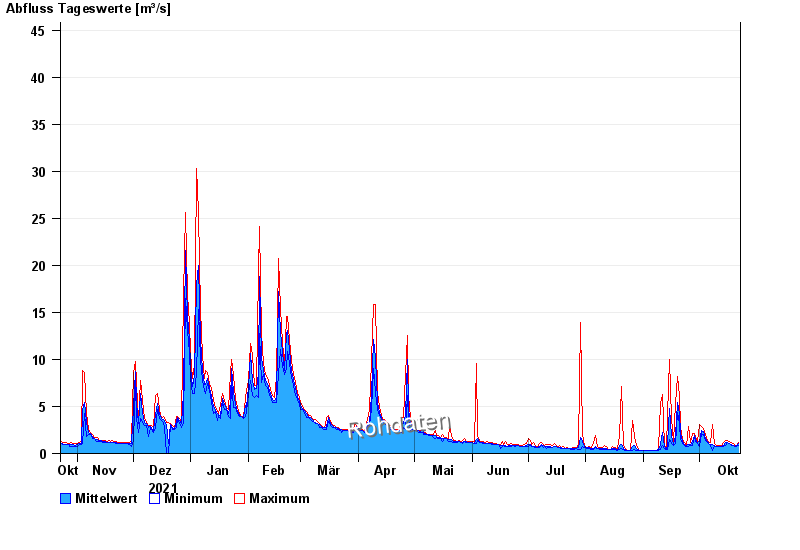
- Chart of year

Chart of year Bayreuth / Roter Main
Discharge from 23.10.2021 to 22.10.2022
- 26.01.1995 Abfluss: 148 m³/s
- 23.02.1970 Abfluss: 130 m³/s
- 02.03.1956 Abfluss: 130 m³/s
- 10.11.1927 Abfluss: 128 m³/s
- 15.01.1968 Abfluss: 120 m³/s
| Date | Mean value [m³/s] | Maximum [m³/s] | Minimum [m³/s] |
|---|---|---|---|
| 22.10.2022 | 1.02 | 1.13 | 0.8 |
| 21.10.2022 | 0.833 | 0.902 | 0.705 |
| 20.10.2022 | 0.788 | 0.8 | 0.705 |
| 19.10.2022 | 0.868 | 1.02 | 0.8 |
| 18.10.2022 | 0.947 | 1.13 | 0.8 |
| 17.10.2022 | 1.1 | 1.26 | 1.02 |
| 16.10.2022 | 1.22 | 1.4 | 1.13 |
© Bayerisches Landesamt für Umwelt 2024