
- Start >
- Rivers >
- Discharge >
- Oberer Main - Elbe >
- Bärenthal >
- Chart of year

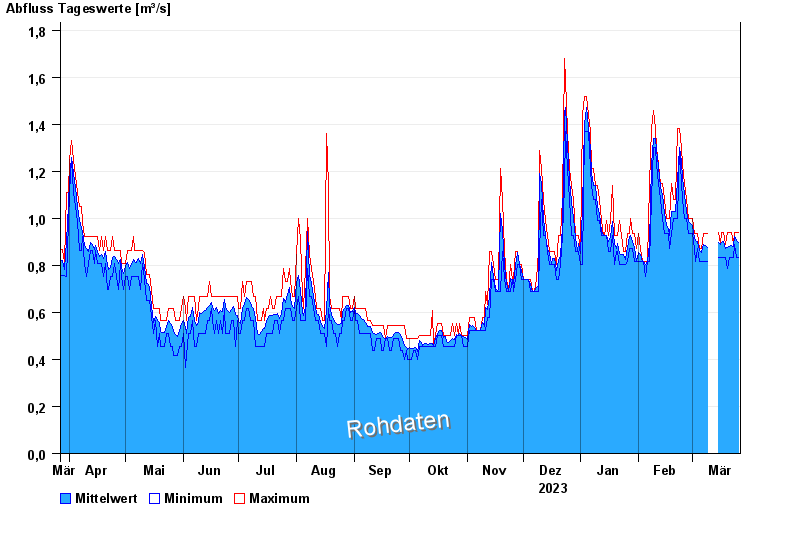
Chart of year Bärenthal / Trubach
Discharge from 27.03.2023 to 26.03.2024
note
Absinken des Wasserstandes wegen Entfernung von Auflandungen.
| Date | Mean value [m³/s] | Maximum [m³/s] | Minimum [m³/s] |
|---|---|---|---|
| 26.03.2024 | 0.899 | 0.94 | 0.835 |
| 25.03.2024 | 0.907 | 0.94 | 0.835 |
| 24.03.2024 | 0.923 | 0.94 | 0.89 |
| 23.03.2024 | 0.879 | 0.89 | 0.835 |
| 22.03.2024 | 0.883 | 0.94 | 0.835 |
| 21.03.2024 | 0.881 | 0.94 | 0.835 |
| 20.03.2024 | 0.877 | 0.94 | 0.786 |
© Bayerisches Landesamt für Umwelt 2024