
- Start >
- Rivers >
- Discharge >
- Oberer Main - Elbe >
- Bärenthal >
- Chart of year

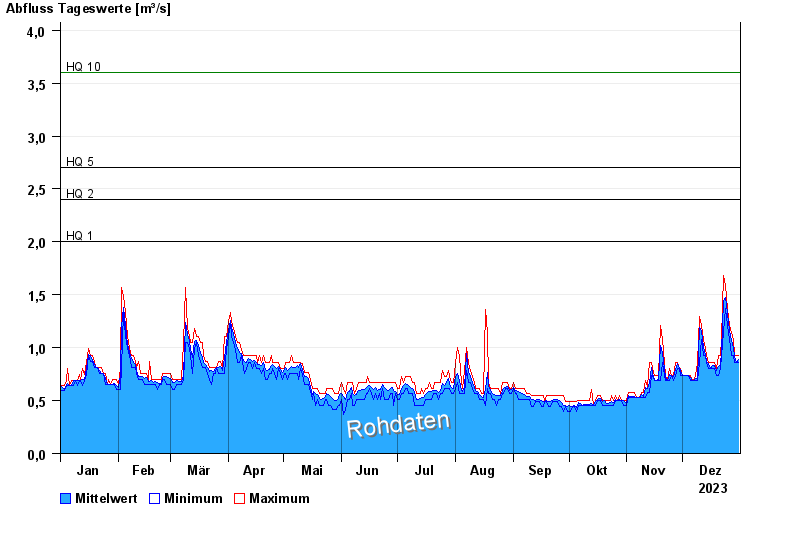
Chart of year Bärenthal / Trubach
Discharge from 01.01.2023 to 31.12.2023
note
Absinken des Wasserstandes wegen Entfernung von Auflandungen.
- HQ1 2 m³/s
- HQ2 2,4 m³/s
- HQ5 2,7 m³/s
- HQ10 3,6 m³/s
- HQ20 5 m³/s
- HQ50 7,5 m³/s
- HQ100 10 m³/s
| Date | Mean value [m³/s] | Maximum [m³/s] | Minimum [m³/s] |
|---|---|---|---|
| 31.12.2023 | 0.891 | 0.925 | 0.86 |
| 30.12.2023 | 0.864 | 0.925 | 0.86 |
| 29.12.2023 | 0.92 | 0.925 | 0.86 |
| 28.12.2023 | 1 | 1.08 | 0.925 |
| 27.12.2023 | 1.07 | 1.14 | 0.925 |
| 26.12.2023 | 1.16 | 1.21 | 1.08 |
| 25.12.2023 | 1.32 | 1.37 | 1.21 |
© Bayerisches Landesamt für Umwelt 2024