
- Start >
- Rivers >
- Discharge >
- Oberer Main - Elbe >
- Bärenthal >
- Chart of year

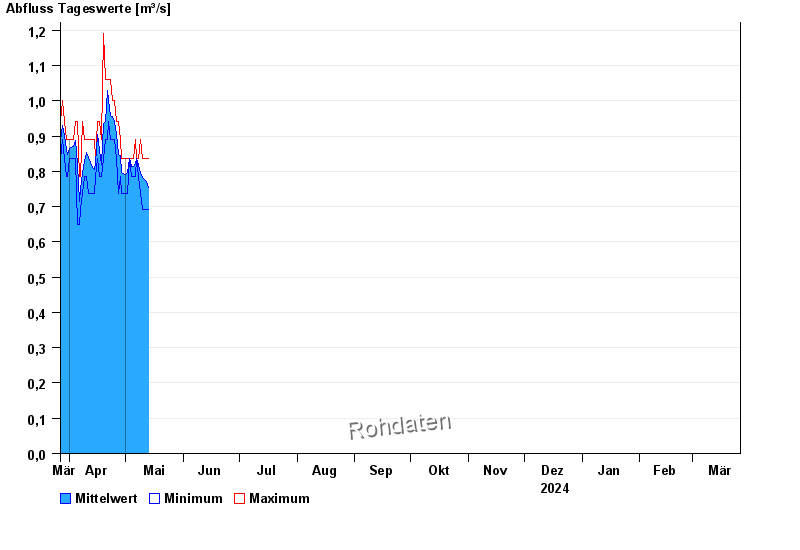
Chart of year Bärenthal / Trubach
Discharge from 27.03.2024 to 26.03.2025
- 22.12.1991 Abfluss: 3,88 m³/s
- 26.01.1995 Abfluss: 3,45 m³/s
- 20.07.2011 Abfluss: 3,26 m³/s
- 13.01.2011 Abfluss: 3,18 m³/s
- 20.03.2002 Abfluss: 3,14 m³/s
| Date | Mean value [m³/s] | Maximum [m³/s] | Minimum [m³/s] |
|---|---|---|---|
| 26.03.2025 | 0.587 | 0.587 | 0.587 |
| 25.03.2025 | 0.578 | 0.637 | 0.5 |
| 24.03.2025 | 0.59 | 0.637 | 0.587 |
| 23.03.2025 | 0.599 | 0.637 | 0.541 |
| 22.03.2025 | 0.605 | 0.637 | 0.541 |
| 21.03.2025 | 0.603 | 0.687 | 0.541 |
| 20.03.2025 | 0.627 | 0.687 | 0.541 |
© Bayerisches Landesamt für Umwelt 2025