
- Start >
- Rivers >
- Discharge >
- Oberer Main - Elbe >
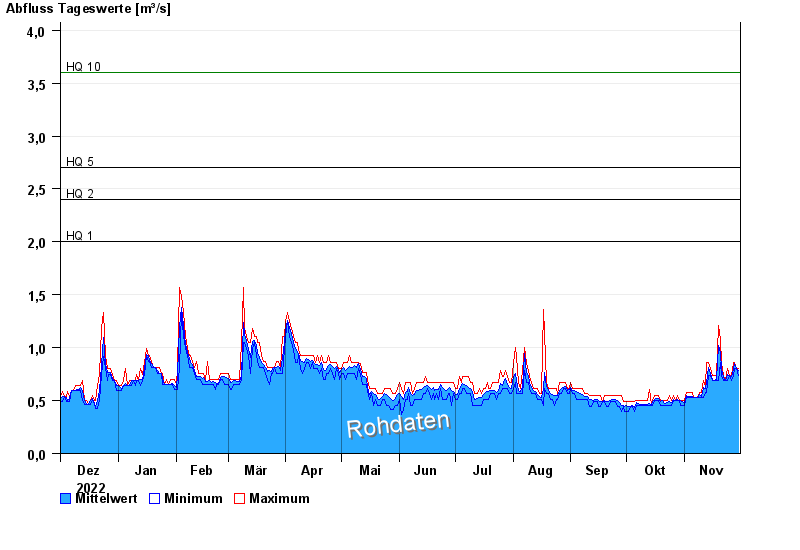
- Bärenthal >
- Chart of year

Chart of year Bärenthal / Trubach
Discharge from 01.12.2022 to 30.11.2023
note
Absinken des Wasserstandes wegen Entfernung von Auflandungen.
- HQ1 2 m³/s
- HQ2 2,4 m³/s
- HQ5 2,7 m³/s
- HQ10 3,6 m³/s
- HQ20 5 m³/s
- HQ50 7,5 m³/s
- HQ100 10 m³/s
| Date | Mean value [m³/s] | Maximum [m³/s] | Minimum [m³/s] |
|---|---|---|---|
| 30.11.2023 | 0.78 | 0.805 | 0.741 |
| 29.11.2023 | 0.805 | 0.805 | 0.805 |
| 28.11.2023 | 0.854 | 0.86 | 0.805 |
| 27.11.2023 | 0.798 | 0.86 | 0.741 |
| 26.11.2023 | 0.725 | 0.741 | 0.687 |
| 25.11.2023 | 0.741 | 0.741 | 0.741 |
| 24.11.2023 | 0.743 | 0.805 | 0.687 |
© Bayerisches Landesamt für Umwelt 2024