
- Start >
- Rivers >
- Discharge >
- Oberer Main - Elbe >
- Bad Berneck >
- Chart of year

Chart of year Bad Berneck / Ölschnitz
Discharge from 22.05.2019 to 21.05.2020
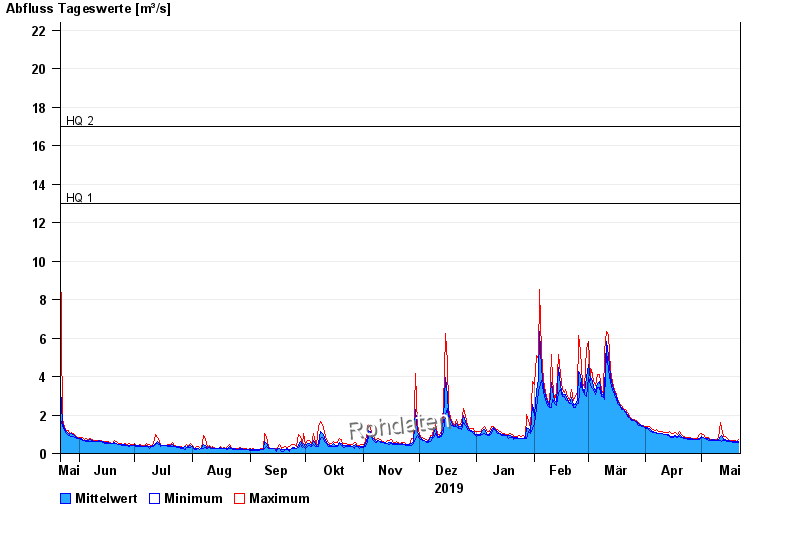
- HQ1 13 m³/s
- HQ2 17 m³/s
- HQ5 23 m³/s
- HQ10 27 m³/s
- HQ20 32 m³/s
- HQ50 38 m³/s
- HQ100 45 m³/s
| Date | Mean value [m³/s] | Maximum [m³/s] | Minimum [m³/s] |
|---|---|---|---|
| 21.05.2020 | 0.606 | 0.739 | 0.587 |
| 20.05.2020 | 0.615 | 0.621 | 0.587 |
| 19.05.2020 | 0.627 | 0.697 | 0.587 |
| 18.05.2020 | 0.631 | 0.658 | 0.587 |
| 17.05.2020 | 0.642 | 0.658 | 0.621 |
| 16.05.2020 | 0.655 | 0.697 | 0.621 |
| 15.05.2020 | 0.692 | 0.776 | 0.621 |
© Bayerisches Landesamt für Umwelt 2024