
- Start >
- Rivers >
- Discharge >
- Oberer Main - Elbe >
- Bad Berneck >
- Chart of year

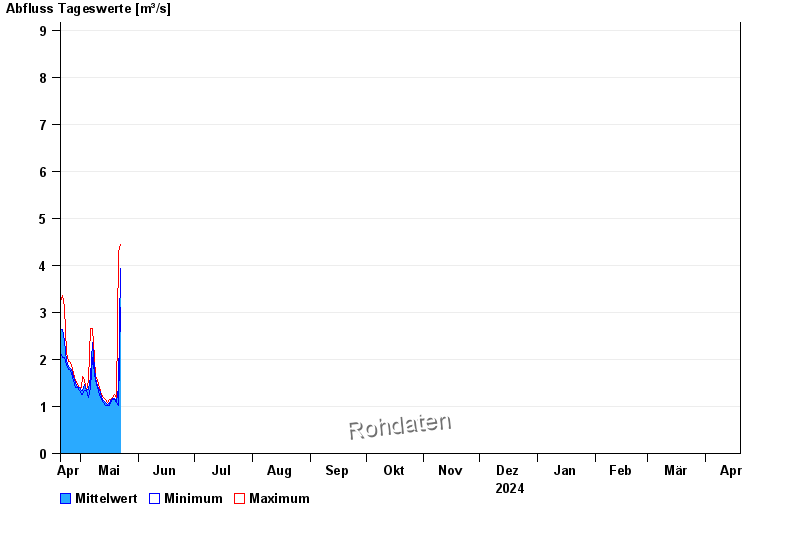
Chart of year Bad Berneck / Ölschnitz
Discharge from 20.04.2024 to 19.04.2025
- HQ1 13 m³/s
- HQ2 17 m³/s
- HQ5 23 m³/s
- HQ10 27 m³/s
- HQ20 32 m³/s
- HQ50 38 m³/s
- HQ100 45 m³/s
| Date | Mean value [m³/s] | Maximum [m³/s] | Minimum [m³/s] |
|---|---|---|---|
| 02.05.2024 | 1.29 | 1.33 | 1.2 |
| 01.05.2024 | 1.35 | 1.4 | 1.26 |
| 30.04.2024 | 1.4 | 1.4 | 1.33 |
| 29.04.2024 | 1.41 | 1.47 | 1.4 |
| 28.04.2024 | 1.52 | 1.55 | 1.4 |
| 27.04.2024 | 1.63 | 1.71 | 1.55 |
| 26.04.2024 | 1.79 | 1.87 | 1.71 |
© Bayerisches Landesamt für Umwelt 2024