
- Start >
- Rivers >
- Discharge >
- Oberer Main - Elbe >
- Bad Berneck >
- Chart of year

Chart of year Bad Berneck / Ölschnitz
Discharge from 01.01.2020 to 31.12.2020
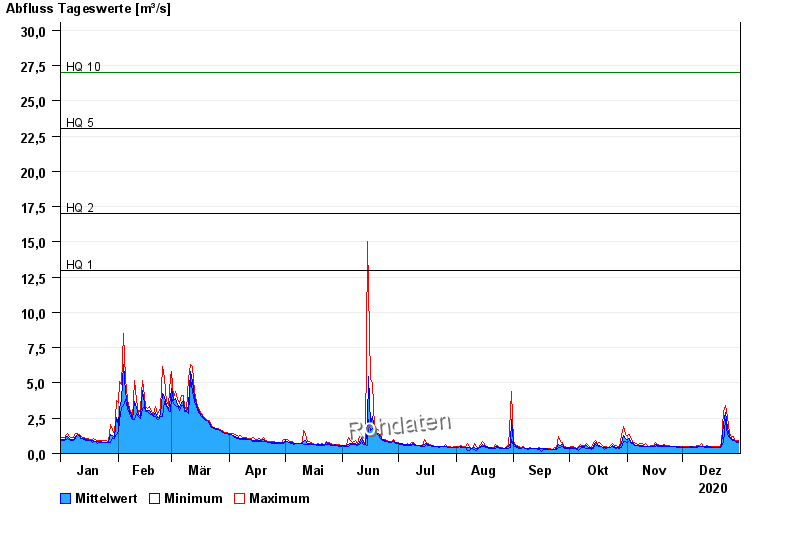
- HQ1 13 m³/s
- HQ2 17 m³/s
- HQ5 23 m³/s
- HQ10 27 m³/s
- HQ20 32 m³/s
- HQ50 38 m³/s
- HQ100 45 m³/s
| Date | Mean value [m³/s] | Maximum [m³/s] | Minimum [m³/s] |
|---|---|---|---|
| 31.12.2020 | 0.817 | 0.898 | 0.754 |
| 30.12.2020 | 0.868 | 0.949 | 0.803 |
| 29.12.2020 | 0.953 | 1 | 0.898 |
| 28.12.2020 | 0.996 | 1.18 | 0.898 |
| 27.12.2020 | 1.07 | 1.12 | 1 |
| 26.12.2020 | 1.24 | 1.45 | 1.12 |
| 25.12.2020 | 1.87 | 2.62 | 1.38 |
© Bayerisches Landesamt für Umwelt 2024