
- Start >
- Rivers >
- Discharge >
- Oberer Main - Elbe >
- Bad Berneck >
- Chart of total period

Chart of total period Bad Berneck / Ölschnitz
Discharge from 01.11.1971 to 26.04.2024
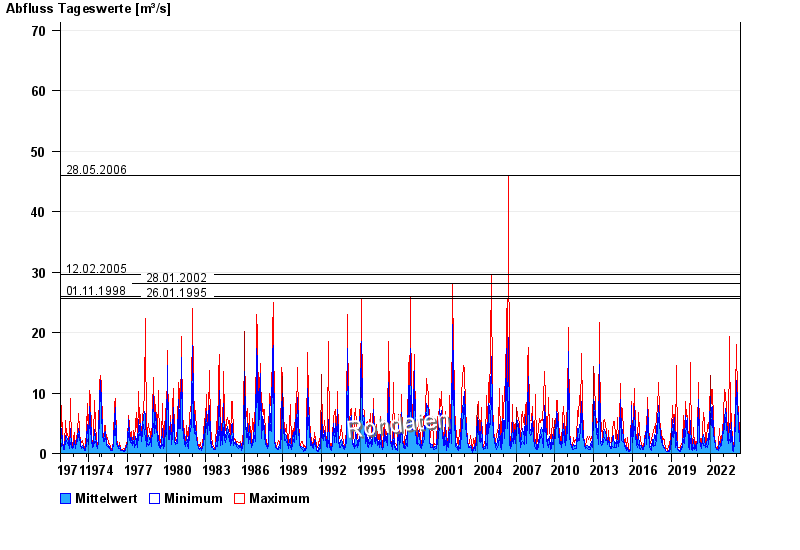
- 28.05.2006 Abfluss: 46 m³/s
- 12.02.2005 Abfluss: 29,6 m³/s
- 28.01.2002 Abfluss: 28,1 m³/s
- 01.11.1998 Abfluss: 25,9 m³/s
- 26.01.1995 Abfluss: 25,6 m³/s
| Date | Mean value [m³/s] | Maximum [m³/s] | Minimum [m³/s] |
|---|---|---|---|
| 26.04.2024 | 1.81 | 1.87 | 1.71 |
| 25.04.2024 | 1.83 | 1.96 | 1.79 |
| 24.04.2024 | 1.84 | 1.96 | 1.79 |
| 23.04.2024 | 1.97 | 2.14 | 1.87 |
| 22.04.2024 | 2.38 | 3.1 | 2.05 |
| 21.04.2024 | 2.64 | 3.35 | 2.05 |
| 20.04.2024 | 2.66 | 3.23 | 2.14 |
© Bayerisches Landesamt für Umwelt 2024