
- Start >
- Rivers >
- Discharge >
- Oberer Main - Elbe >
- Bad Berneck >
- Chart of year

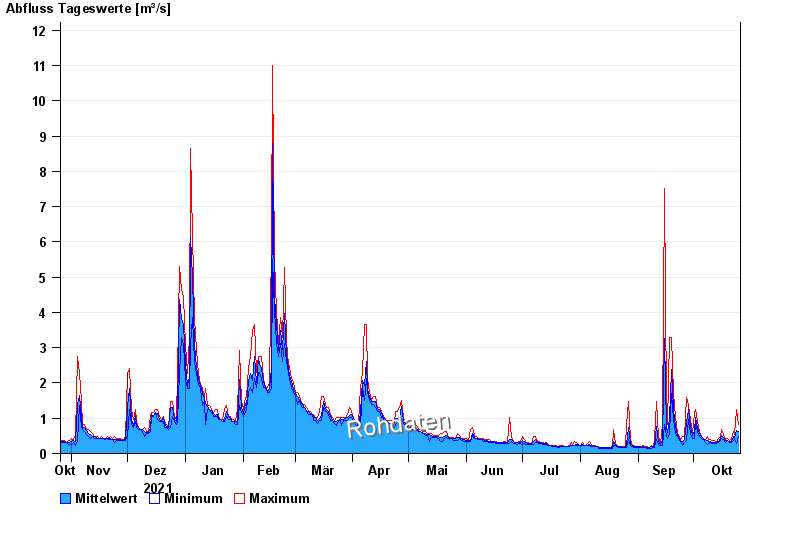
Chart of year Bad Berneck / Weißer Main
Discharge from 26.10.2021 to 25.10.2022
| Date | Mean value [m³/s] | Maximum [m³/s] | Minimum [m³/s] |
|---|---|---|---|
| 25.10.2022 | 0.611 | 0.818 | 0.477 |
| 24.10.2022 | 0.664 | 1.25 | 0.291 |
| 23.10.2022 | 0.43 | 0.525 | 0.392 |
| 22.10.2022 | 0.493 | 0.629 | 0.356 |
| 21.10.2022 | 0.35 | 0.392 | 0.322 |
| 20.10.2022 | 0.35 | 0.356 | 0.322 |
| 19.10.2022 | 0.378 | 0.432 | 0.356 |
© Bayerisches Landesamt für Umwelt 2024