
- Start >
- Rivers >
- Discharge >
- Oberer Main - Elbe >
- Bad Berneck >
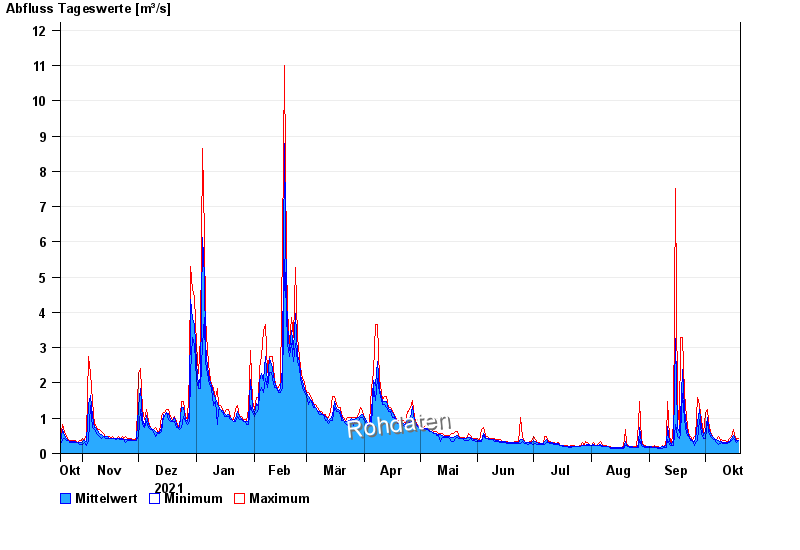
- Chart of year

Chart of year Bad Berneck / Weißer Main
Discharge from 20.10.2021 to 19.10.2022
| Date | Mean value [m³/s] | Maximum [m³/s] | Minimum [m³/s] |
|---|---|---|---|
| 19.10.2022 | 0.378 | 0.432 | 0.356 |
| 18.10.2022 | 0.379 | 0.392 | 0.322 |
| 17.10.2022 | 0.458 | 0.525 | 0.392 |
| 16.10.2022 | 0.522 | 0.687 | 0.432 |
| 15.10.2022 | 0.439 | 0.477 | 0.356 |
| 14.10.2022 | 0.344 | 0.432 | 0.322 |
| 13.10.2022 | 0.32 | 0.322 | 0.291 |
© Bayerisches Landesamt für Umwelt 2024