
- Start >
- Rivers >
- Discharge >
- Oberer Main - Elbe >
- Bad Berneck >
- Chart of year

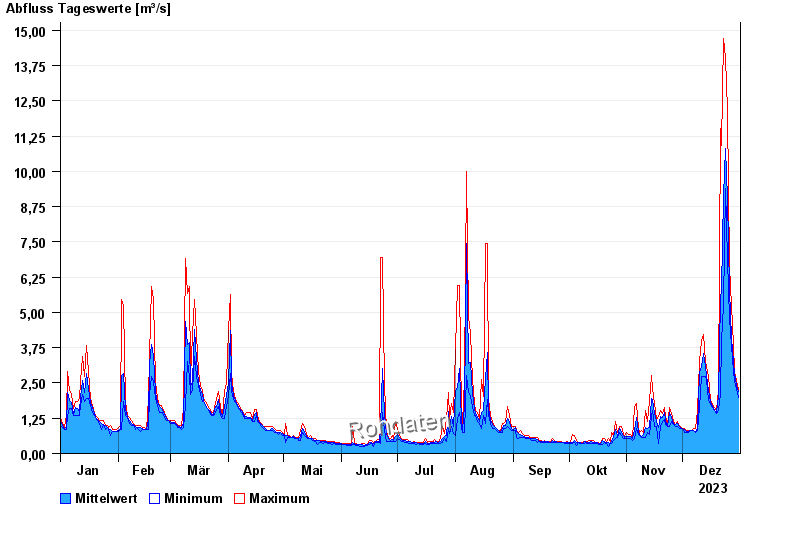
Chart of year Bad Berneck / Weißer Main
Discharge from 01.01.2023 to 31.12.2023
| Date | Mean value [m³/s] | Maximum [m³/s] | Minimum [m³/s] |
|---|---|---|---|
| 31.12.2023 | 2.21 | 2.28 | 2 |
| 30.12.2023 | 2.42 | 2.58 | 2.28 |
| 29.12.2023 | 2.82 | 2.91 | 2.58 |
| 28.12.2023 | 3.23 | 3.82 | 2.91 |
| 27.12.2023 | 4.11 | 5.23 | 3.82 |
| 26.12.2023 | 5.77 | 6.63 | 4.8 |
| 25.12.2023 | 9.05 | 12.2 | 6.88 |
© Bayerisches Landesamt für Umwelt 2024