
- Start >
- Rivers >
- Discharge >
- Oberer Main - Elbe >
- Bad Berneck >
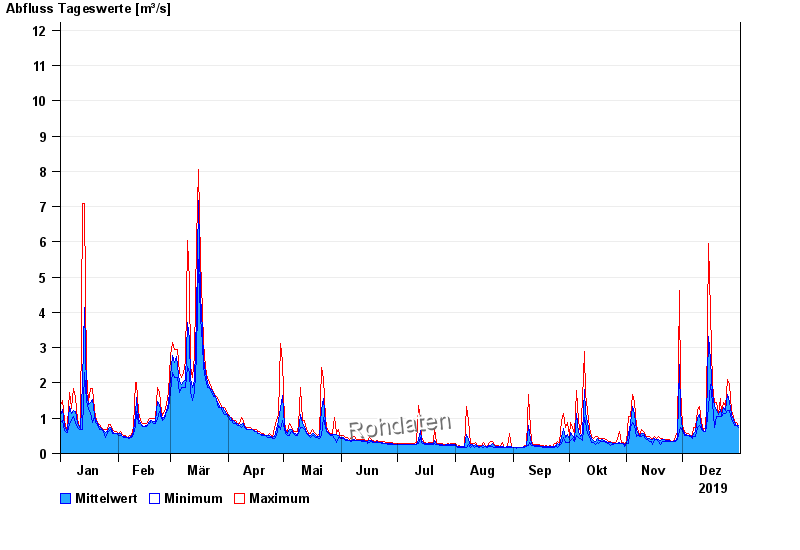
- Chart of year

Chart of year Bad Berneck / Weißer Main
Discharge from 01.01.2019 to 31.12.2019
- 28.05.2006 Abfluss: 42,2 m³/s
- 01.11.1998 Abfluss: 22,3 m³/s
- 10.03.1981 Abfluss: 21,5 m³/s
- 28.01.2002 Abfluss: 21,4 m³/s
- 29.06.1966 Abfluss: 21 m³/s
| Date | Mean value [m³/s] | Maximum [m³/s] | Minimum [m³/s] |
|---|---|---|---|
| 31.12.2019 | 0.803 | 0.805 | 0.738 |
| 30.12.2019 | 0.807 | 0.883 | 0.805 |
| 29.12.2019 | 0.872 | 0.883 | 0.805 |
| 28.12.2019 | 0.95 | 1.05 | 0.883 |
| 27.12.2019 | 1.11 | 1.23 | 0.961 |
| 26.12.2019 | 1.48 | 1.95 | 1.23 |
| 25.12.2019 | 1.68 | 2.09 | 1.23 |
© Bayerisches Landesamt für Umwelt 2024