
- Start >
- Rivers >
- Discharge >
- Oberer Main - Elbe >
- Arzberg >
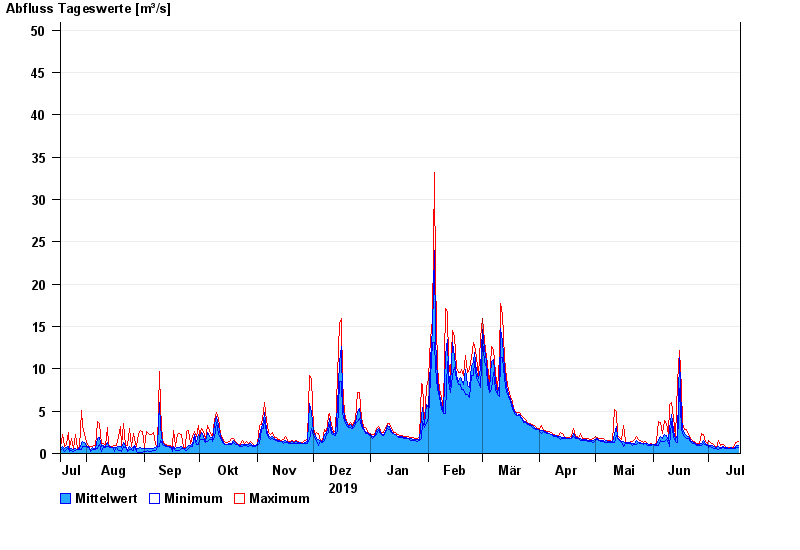
- Chart of year

Chart of year Arzberg / Röslau
Discharge from 18.07.2019 to 17.07.2020
- 01.09.1977 Abfluss: 89 m³/s
- 01.11.1998 Abfluss: 84,2 m³/s
- 06.01.1982 Abfluss: 82,9 m³/s
- 28.05.2006 Abfluss: 81,6 m³/s
- 06.02.1980 Abfluss: 80,5 m³/s
| Date | Mean value [m³/s] | Maximum [m³/s] | Minimum [m³/s] |
|---|---|---|---|
| 17.07.2020 | 1.2 | 1.75 | 0.828 |
| 16.07.2020 | 1.11 | 1.54 | 0.828 |
| 15.07.2020 | 0.849 | 1.54 | 0.688 |
| 14.07.2020 | 0.735 | 0.828 | 0.688 |
| 13.07.2020 | 0.802 | 0.904 | 0.755 |
| 12.07.2020 | 0.78 | 0.828 | 0.755 |
| 11.07.2020 | 0.804 | 0.828 | 0.755 |
© Bayerisches Landesamt für Umwelt 2024