
- Start >
- Rivers >
- Discharge >
- Oberer Main - Elbe >
- Aeschach >
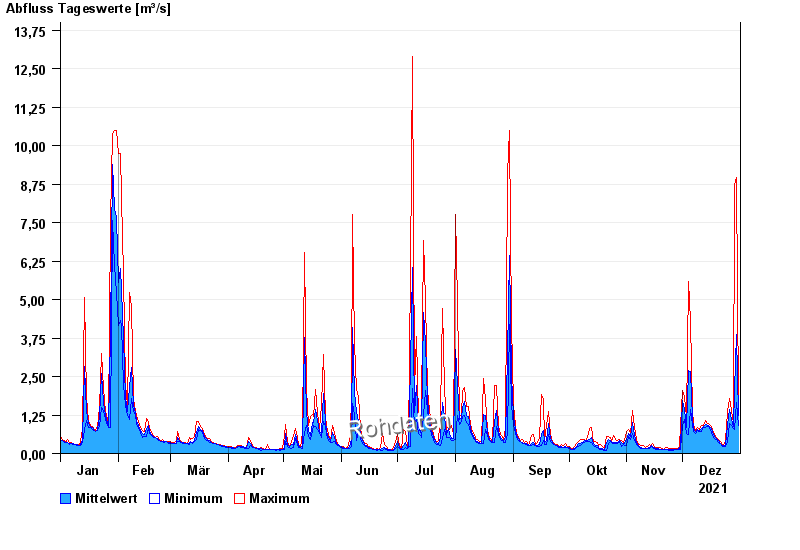
- Chart of year

Chart of year Aeschach / Oberreitnauer Ach
Discharge from 01.01.2021 to 31.12.2021
| Date | Mean value [m³/s] | Maximum [m³/s] | Minimum [m³/s] |
|---|---|---|---|
| 31.12.2021 | 1.42 | 1.86 | 1.08 |
| 30.12.2021 | 4.08 | 9.36 | 1.86 |
| 29.12.2021 | 2.34 | 9.1 | 0.939 |
| 28.12.2021 | 1.05 | 1.15 | 0.968 |
| 27.12.2021 | 1.29 | 1.58 | 1.07 |
| 26.12.2021 | 1.63 | 1.98 | 1.14 |
| 25.12.2021 | 1.08 | 1.54 | 0.531 |
© Bayerisches Landesamt für Umwelt 2024