
- Start >
- Rivers >
- Discharge >
- Oberer Main - Elbe >
- Aeschach >
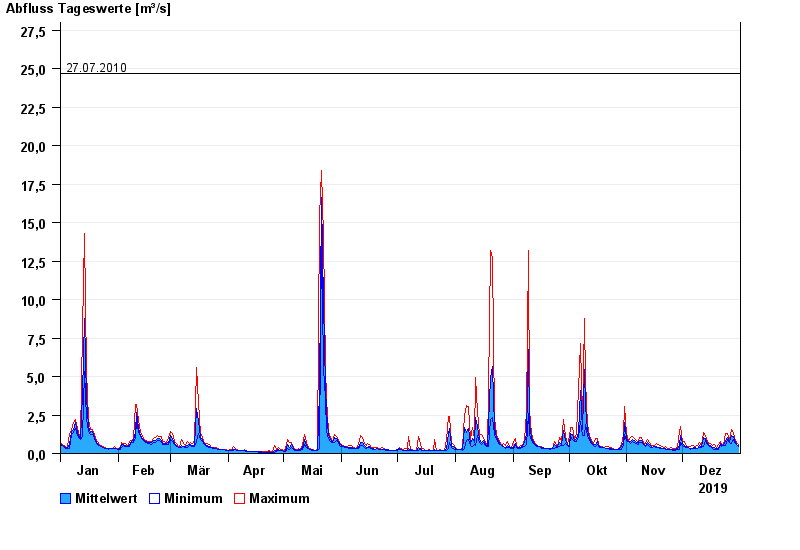
- Chart of year

Chart of year Aeschach / Oberreitnauer Ach
Discharge from 01.01.2019 to 31.12.2019
- 18.06.2010 Abfluss: 39,3 m³/s
- 11.08.2002 Abfluss: 35,7 m³/s
- 02.06.2013 Abfluss: 29,2 m³/s
- 17.06.1991 Abfluss: 29,2 m³/s
- 09.08.2007 Abfluss: 27,7 m³/s
| Date | Mean value [m³/s] | Maximum [m³/s] | Minimum [m³/s] |
|---|---|---|---|
| 31.12.2019 | 0.504 | 0.558 | 0.477 |
| 30.12.2019 | 0.608 | 0.705 | 0.558 |
| 29.12.2019 | 0.813 | 1.01 | 0.705 |
| 28.12.2019 | 1.1 | 1.31 | 0.935 |
| 27.12.2019 | 1.18 | 1.55 | 0.676 |
| 26.12.2019 | 0.796 | 0.936 | 0.706 |
| 25.12.2019 | 1.06 | 1.31 | 0.936 |
© Bayerisches Landesamt für Umwelt 2024