
- Start >
- Rivers >
- Discharge >
- Oberer Main - Elbe >
- Aeschach >
- Chart of year

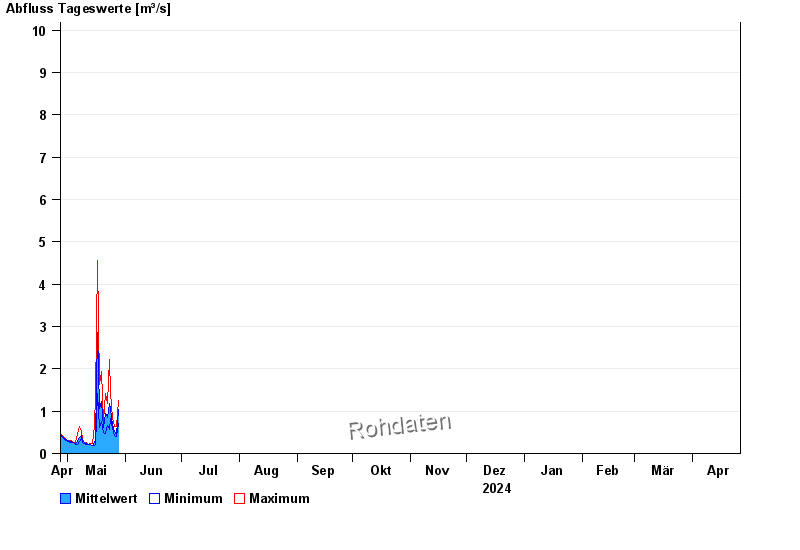
Chart of year Aeschach / Oberreitnauer Ach
Discharge from 27.04.2024 to 26.04.2025
 Für diesen Pegel sind keine Jährlichkeiten hinterlegt.
| Date | Mean value [m³/s] | Maximum [m³/s] | Minimum [m³/s] |
|---|---|---|---|
| 06.05.2024 | 0.267 | 0.402 | 0.218 |
| 05.05.2024 | 0.253 | 0.253 | 0.253 |
| 04.05.2024 | 0.269 | 0.271 | 0.253 |
| 03.05.2024 | 0.284 | 0.311 | 0.271 |
| 02.05.2024 | 0.29 | 0.311 | 0.271 |
| 01.05.2024 | 0.308 | 0.311 | 0.291 |
| 30.04.2024 | 0.33 | 0.333 | 0.311 |
© Bayerisches Landesamt für Umwelt 2024