

Chart of year Würzburg / Main
Discharge from 01.01.2019 to 31.12.2019
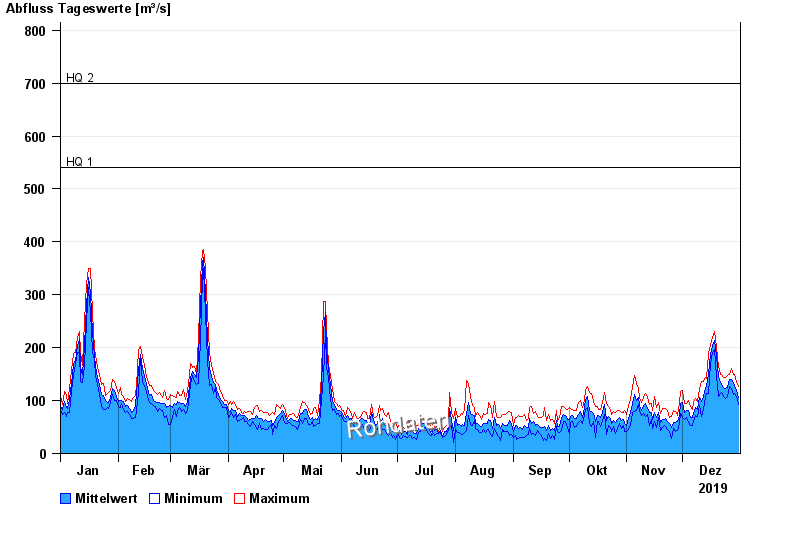
- HQ1 540 m³/s
- HQ2 700 m³/s
- HQ5 920 m³/s
- HQ10 1130 m³/s
- HQ20 1400 m³/s
- HQ50 1700 m³/s
- HQ100 2000 m³/s
| Date | Mean value [m³/s] | Maximum [m³/s] | Minimum [m³/s] |
|---|---|---|---|
| 31.12.2019 | 106 | 126 | 92.7 |
| 30.12.2019 | 119 | 134 | 107 |
| 29.12.2019 | 127 | 150 | 113 |
| 28.12.2019 | 134 | 150 | 112 |
| 27.12.2019 | 139 | 160 | 123 |
| 26.12.2019 | 139 | 150 | 126 |
| 25.12.2019 | 125 | 147 | 108 |
© Bayerisches Landesamt für Umwelt 2024