
- Start >
- Rivers >
- Discharge >
- Bayern >
- Witzelsmühle Silberseeabfluss >
- Chart of total period

Chart of total period Witzelsmühle Silberseeabfluss / Bayerische Schwarzach
Discharge from 01.11.1970 to 02.05.2024
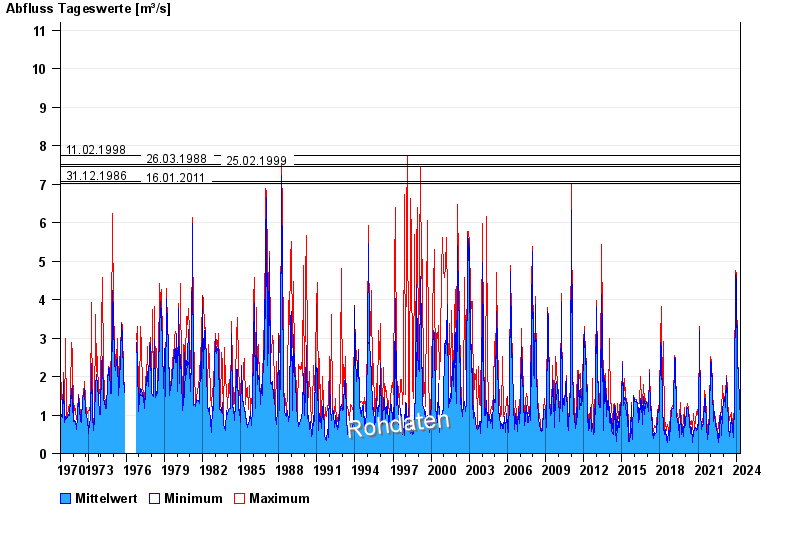
- 11.02.1998 Abfluss: 7,75 m³/s
- 26.03.1988 Abfluss: 7,51 m³/s
- 25.02.1999 Abfluss: 7,45 m³/s
- 31.12.1986 Abfluss: 7,06 m³/s
- 16.01.2011 Abfluss: 7,01 m³/s
| Date | Mean value [m³/s] | Maximum [m³/s] | Minimum [m³/s] |
|---|---|---|---|
| 02.05.2024 | 1.14 | 1.14 | 1.14 |
| 01.05.2024 | 1.14 | 1.19 | 1.14 |
| 30.04.2024 | 1.15 | 1.19 | 1.14 |
| 29.04.2024 | 1.18 | 1.19 | 1.14 |
| 28.04.2024 | 1.19 | 1.19 | 1.14 |
| 27.04.2024 | 1.19 | 1.19 | 1.19 |
| 26.04.2024 | 1.19 | 1.19 | 1.19 |
© Bayerisches Landesamt für Umwelt 2024