

Chart of year Wirsberg / Schorgast
Discharge from 01.01.2022 to 31.12.2022
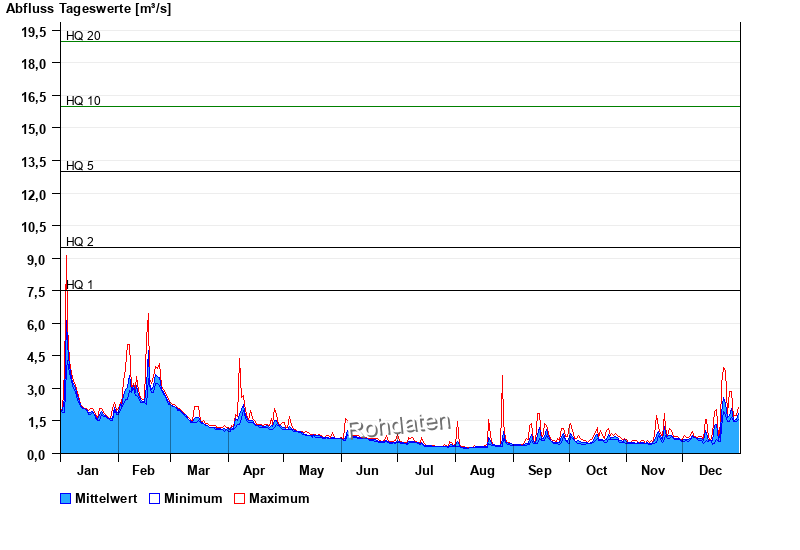
- HQ1 7,5 m³/s
- HQ2 9,5 m³/s
- HQ5 13 m³/s
- HQ10 16 m³/s
- HQ20 19 m³/s
- HQ50 24 m³/s
- HQ100 28 m³/s
| Date | Mean value [m³/s] | Maximum [m³/s] | Minimum [m³/s] |
|---|---|---|---|
| 31.12.2022 | 1.83 | 2.13 | 1.57 |
| 30.12.2022 | 1.58 | 1.75 | 1.48 |
| 29.12.2022 | 1.52 | 1.75 | 1.48 |
| 28.12.2022 | 1.56 | 1.66 | 1.48 |
| 27.12.2022 | 2.09 | 2.84 | 1.66 |
| 26.12.2022 | 1.74 | 2.84 | 1.48 |
| 25.12.2022 | 1.64 | 1.84 | 1.48 |
© Bayerisches Landesamt für Umwelt 2024