

Chart of year Wirsberg / Schorgast
Discharge from 29.03.2024 to 28.03.2025
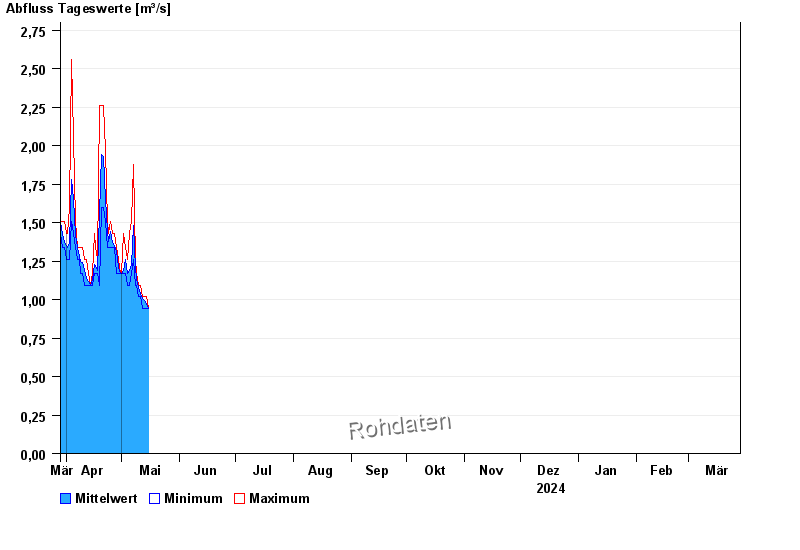
| Date | Mean value [m³/s] | Maximum [m³/s] | Minimum [m³/s] |
|---|---|---|---|
| 13.05.2024 | 0.998 | 1.02 | 0.944 |
| 12.05.2024 | 1.01 | 1.02 | 0.944 |
| 11.05.2024 | 1.04 | 1.09 | 1.02 |
| 10.05.2024 | 1.08 | 1.09 | 1.02 |
| 09.05.2024 | 1.14 | 1.17 | 1.09 |
| 08.05.2024 | 1.2 | 1.26 | 1.09 |
| 07.05.2024 | 1.48 | 1.88 | 1.26 |
© Bayerisches Landesamt für Umwelt 2024