

Chart of year Wirsberg / Schorgast
Discharge from 01.01.2023 to 31.12.2023
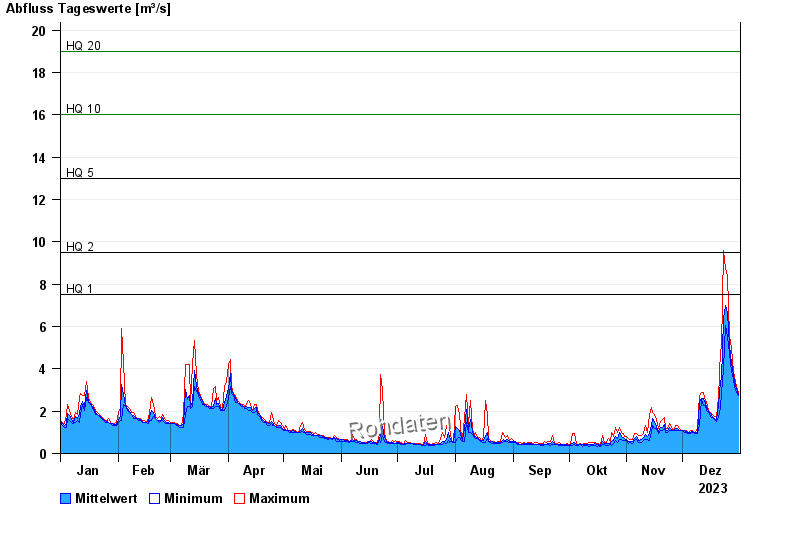
- HQ1 7,5 m³/s
- HQ2 9,5 m³/s
- HQ5 13 m³/s
- HQ10 16 m³/s
- HQ20 19 m³/s
- HQ50 24 m³/s
- HQ100 28 m³/s
| Date | Mean value [m³/s] | Maximum [m³/s] | Minimum [m³/s] |
|---|---|---|---|
| 31.12.2023 | 2.8 | 2.86 | 2.75 |
| 30.12.2023 | 3.06 | 3.18 | 2.86 |
| 29.12.2023 | 3.4 | 3.63 | 3.18 |
| 28.12.2023 | 3.73 | 3.86 | 3.51 |
| 27.12.2023 | 4.27 | 4.98 | 3.86 |
| 26.12.2023 | 5.12 | 5.51 | 4.72 |
| 25.12.2023 | 6.68 | 8.4 | 5.51 |
© Bayerisches Landesamt für Umwelt 2024