

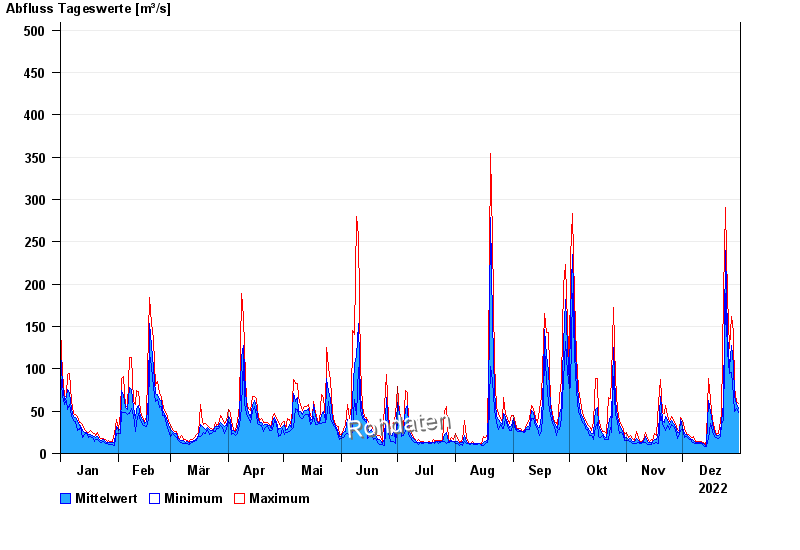
Chart of year Wiblingen / Iller
Discharge from 01.01.2022 to 31.12.2022
- 23.05.1999 Abfluss: 900 m³/s
- 24.08.2005 Abfluss: 850 m³/s
- 24.11.1944 Abfluss: 791 m³/s
- 31.05.1940 Abfluss: 779 m³/s
- 15.05.1930 Abfluss: 690 m³/s
| Date | Mean value [m³/s] | Maximum [m³/s] | Minimum [m³/s] |
|---|---|---|---|
| 31.12.2022 | 52.9 | 58.5 | 48.4 |
| 30.12.2022 | 57.5 | 61.4 | 53.7 |
| 29.12.2022 | 68 | 77.4 | 50.1 |
| 28.12.2022 | 104 | 143 | 67.6 |
| 27.12.2022 | 127 | 162 | 95.4 |
| 26.12.2022 | 102 | 124 | 94.2 |
| 25.12.2022 | 142 | 186 | 120 |
© Bayerisches Landesamt für Umwelt 2024