

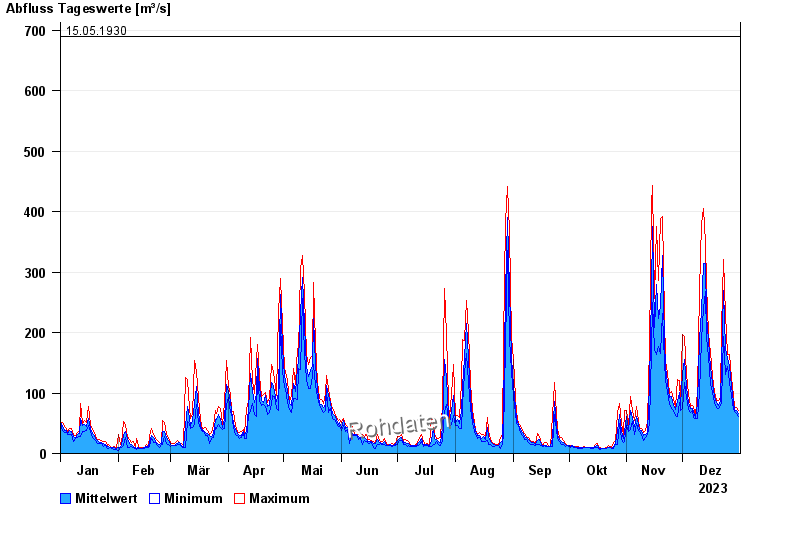
Chart of year Wiblingen / Iller
Discharge from 01.01.2023 to 31.12.2023
- 23.05.1999 Abfluss: 900 m³/s
- 24.08.2005 Abfluss: 850 m³/s
- 24.11.1944 Abfluss: 791 m³/s
- 31.05.1940 Abfluss: 779 m³/s
- 15.05.1930 Abfluss: 690 m³/s
| Date | Mean value [m³/s] | Maximum [m³/s] | Minimum [m³/s] |
|---|---|---|---|
| 31.12.2023 | 65.4 | 71.1 | 60.7 |
| 30.12.2023 | 71.4 | 75.5 | 66.8 |
| 29.12.2023 | 73 | 76.7 | 70 |
| 28.12.2023 | 84.6 | 95.6 | 72.2 |
| 27.12.2023 | 111 | 125 | 95.6 |
| 26.12.2023 | 145 | 163 | 117 |
| 25.12.2023 | 157 | 164 | 144 |
© Bayerisches Landesamt für Umwelt 2024