
- Start >
- Rivers >
- Discharge >
- Bayern >
- Wendelstein >
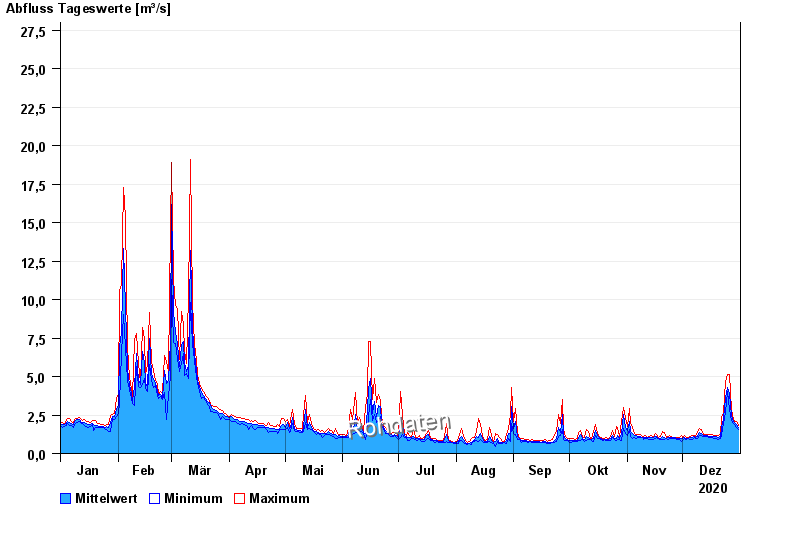
- Chart of year

Chart of year Wendelstein / Schwarzach
Discharge from 01.01.2020 to 31.12.2020
- 21.12.1993 Abfluss: 100 m³/s
- 14.01.2011 Abfluss: 86,9 m³/s
- 23.12.2012 Abfluss: 81,2 m³/s
- 26.01.1995 Abfluss: 78,1 m³/s
- 03.03.1987 Abfluss: 67 m³/s
| Date | Mean value [m³/s] | Maximum [m³/s] | Minimum [m³/s] |
|---|---|---|---|
| 31.12.2020 | 1.69 | 1.82 | 1.56 |
| 30.12.2020 | 1.87 | 2.05 | 1.71 |
| 29.12.2020 | 2.01 | 2.1 | 1.87 |
| 28.12.2020 | 2.07 | 2.22 | 1.97 |
| 27.12.2020 | 2.46 | 2.89 | 2.15 |
| 26.12.2020 | 3.87 | 5.13 | 2.89 |
| 25.12.2020 | 4.31 | 5.13 | 4.02 |
© Bayerisches Landesamt für Umwelt 2024