
- Start >
- Rivers >
- Discharge >
- Bayern >
- Weinzierlein >
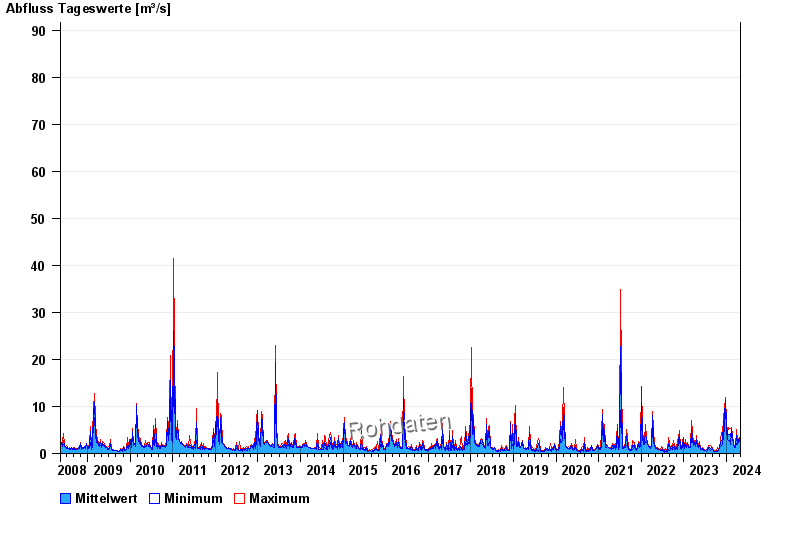
- Chart of total period

Chart of total period Weinzierlein / Bibert
Discharge from 14.05.2008 to 29.04.2024
 Für diesen Pegel sind keine Jährlichkeiten hinterlegt.
| Date | Mean value [m³/s] | Maximum [m³/s] | Minimum [m³/s] |
|---|---|---|---|
| 29.04.2024 | 1.81 | 1.85 | 1.75 |
| 28.04.2024 | 1.89 | 1.97 | 1.75 |
| 27.04.2024 | 1.96 | 2.08 | 1.8 |
| 26.04.2024 | 2.06 | 2.14 | 1.97 |
| 25.04.2024 | 2.14 | 2.27 | 2.02 |
| 24.04.2024 | 2.23 | 2.27 | 2.14 |
| 23.04.2024 | 2.33 | 2.47 | 2.14 |
© Bayerisches Landesamt für Umwelt 2024