

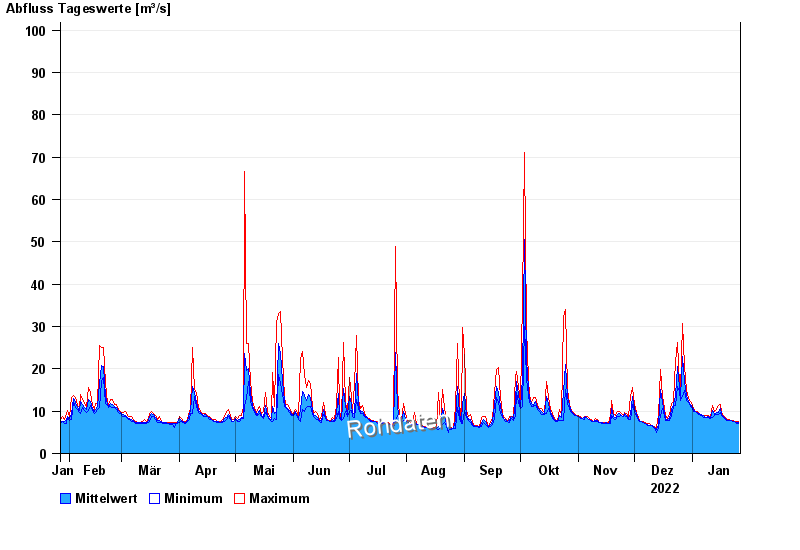
Chart of year Weilheim / Ammer
Discharge from 27.01.2022 to 26.01.2023
- 22.05.1999 Abfluss: 530 m³/s
- 23.08.2005 Abfluss: 463 m³/s
- 07.07.1946 Abfluss: 461 m³/s
- 31.05.1940 Abfluss: 400 m³/s
- 10.08.1970 Abfluss: 338 m³/s
| Date | Mean value [m³/s] | Maximum [m³/s] | Minimum [m³/s] |
|---|---|---|---|
| 26.01.2023 | 7.38 | 7.45 | 7.12 |
| 25.01.2023 | 7.44 | 7.45 | 7.12 |
| 24.01.2023 | 7.45 | 7.45 | 7.45 |
| 23.01.2023 | 7.53 | 7.78 | 7.45 |
| 22.01.2023 | 7.78 | 7.78 | 7.78 |
| 21.01.2023 | 7.8 | 8.11 | 7.78 |
| 20.01.2023 | 7.87 | 8.11 | 7.78 |
© Bayerisches Landesamt für Umwelt 2024