

Chart of year Weilheim / Ammer
Discharge from 20.04.2024 to 19.04.2025
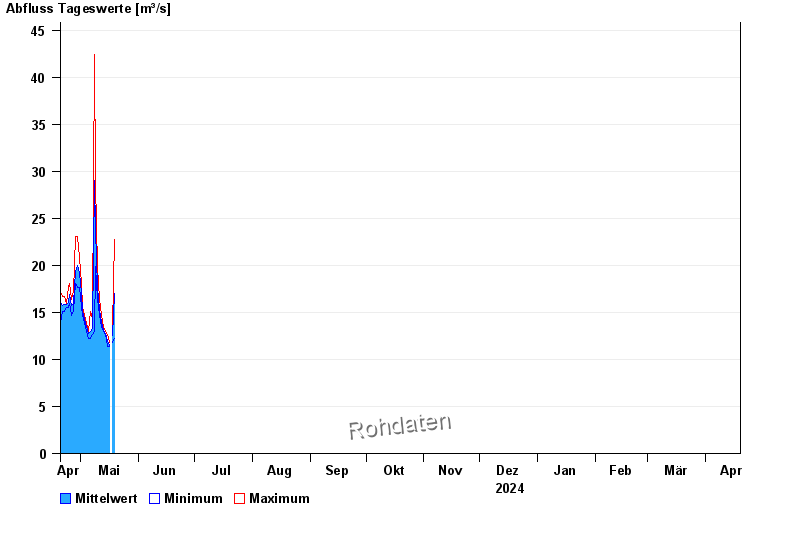
| Date | Mean value [m³/s] | Maximum [m³/s] | Minimum [m³/s] |
|---|---|---|---|
| 17.05.2024 | 11.9 | 12.6 | 11.4 |
| 16.05.2024 | 11.5 | 11.8 | 11.4 |
| 15.05.2024 | 11.9 | 12.6 | 11.4 |
| 14.05.2024 | 12.8 | 13 | 12.6 |
| 13.05.2024 | 13.1 | 13.4 | 13 |
| 12.05.2024 | 13.9 | 14.7 | 13.4 |
| 11.05.2024 | 15.3 | 16.4 | 14.7 |
© Bayerisches Landesamt für Umwelt 2024