

Chart of year Weilheim / Ammer
Discharge from 01.01.2021 to 31.12.2021
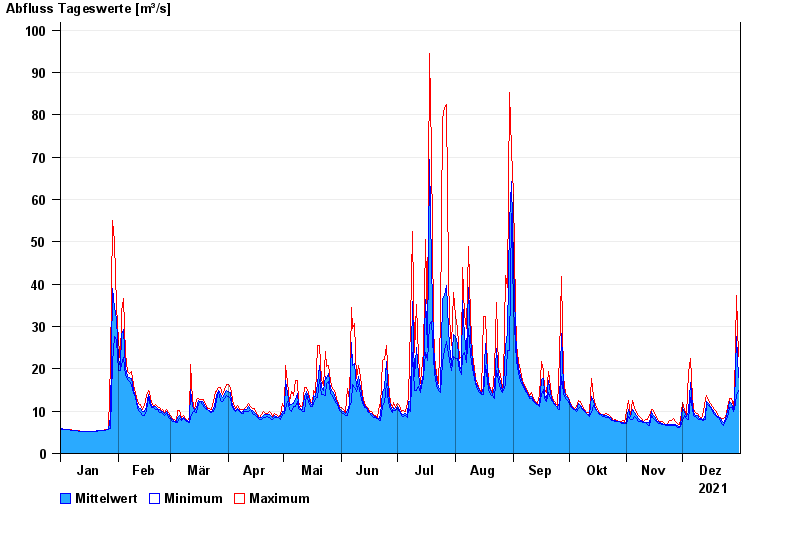
| Date | Mean value [m³/s] | Maximum [m³/s] | Minimum [m³/s] |
|---|---|---|---|
| 31.12.2021 | 17.9 | 22.9 | 14.8 |
| 30.12.2021 | 27.6 | 37.4 | 13.6 |
| 29.12.2021 | 11.8 | 13.6 | 10.4 |
| 28.12.2021 | 10.5 | 11.2 | 10 |
| 27.12.2021 | 11.8 | 13.1 | 10.8 |
| 26.12.2021 | 12.2 | 13.1 | 10.8 |
| 25.12.2021 | 9.88 | 10.8 | 8.54 |
© Bayerisches Landesamt für Umwelt 2024