

Chart of year Weilbach / Mud
Discharge from 02.07.2022 to 01.07.2023
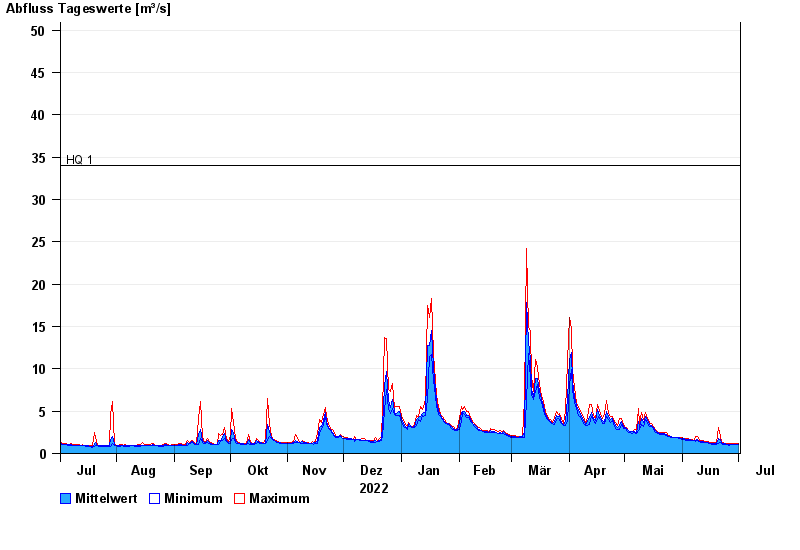
- HQ1 34 m³/s
- HQ2 55 m³/s
- HQ5 85 m³/s
- HQ10 105 m³/s
- HQ20 130 m³/s
- HQ50 155 m³/s
- HQ100 180 m³/s
| Date | Mean value [m³/s] | Maximum [m³/s] | Minimum [m³/s] |
|---|---|---|---|
| 01.07.2023 | 1.09 | 1.17 | 1.04 |
| 30.06.2023 | 1.11 | 1.17 | 1.04 |
| 29.06.2023 | 1.08 | 1.17 | 1.05 |
| 28.06.2023 | 1.09 | 1.17 | 1.05 |
| 27.06.2023 | 1.11 | 1.17 | 1.05 |
| 26.06.2023 | 1.11 | 1.17 | 0.99 |
| 25.06.2023 | 1.12 | 1.18 | 1.05 |
© Bayerisches Landesamt für Umwelt 2024