
- Start >
- Rivers >
- Discharge >
- Bayern >
- Weichselbaum >
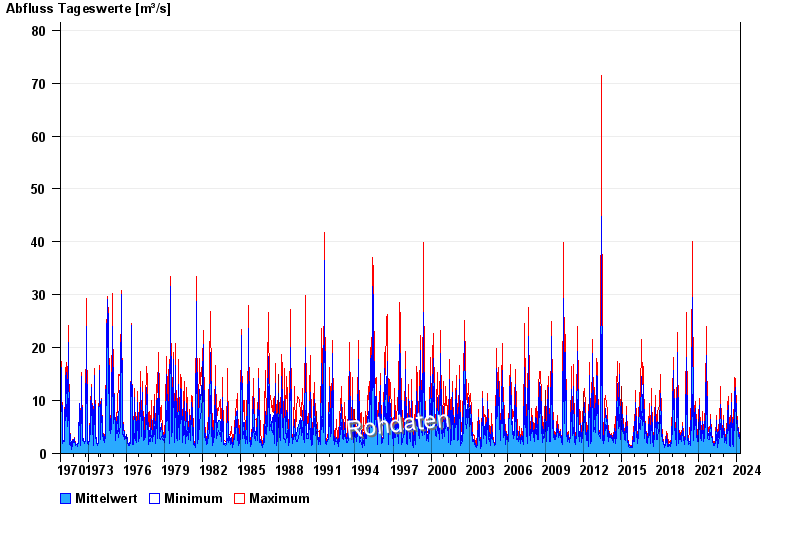
- Chart of total period

Chart of total period Weichselbaum / Murn
Discharge from 01.11.1970 to 04.05.2024
| Date | Mean value [m³/s] | Maximum [m³/s] | Minimum [m³/s] |
|---|---|---|---|
| 04.05.2024 | 1.71 | 1.71 | 1.59 |
| 03.05.2024 | 1.62 | 1.71 | 1.47 |
| 02.05.2024 | 1.65 | 1.83 | 1.59 |
| 01.05.2024 | 1.73 | 1.83 | 1.71 |
| 30.04.2024 | 1.83 | 1.96 | 1.71 |
| 29.04.2024 | 1.96 | 2.09 | 1.96 |
| 28.04.2024 | 2.12 | 2.23 | 2.09 |
© Bayerisches Landesamt für Umwelt 2024