
- Start >
- Rivers >
- Discharge >
- Bayern >
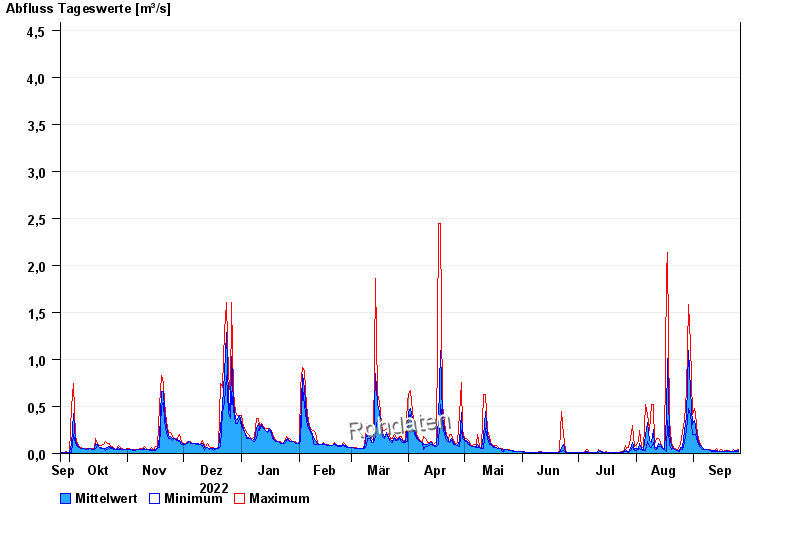
- Weiboldshausen >
- Chart of year

Chart of year Weiboldshausen / Felchbach
Discharge from 26.09.2022 to 25.09.2023
note
Wasserstand und Abfluss wird zeitweise durch Biberdamm beeinflusst.
- HQ1 7 m³/s
- HQ2 11 m³/s
- HQ5 12 m³/s
- HQ10 14 m³/s
- HQ20 17 m³/s
- HQ50 20 m³/s
- HQ100 23 m³/s
| Date | Mean value [m³/s] | Maximum [m³/s] | Minimum [m³/s] |
|---|---|---|---|
| 25.09.2023 | 0.033 | 0.038 | 0.025 |
| 24.09.2023 | 0.027 | 0.032 | 0.025 |
| 23.09.2023 | 0.031 | 0.032 | 0.025 |
| 22.09.2023 | 0.026 | 0.038 | 0.019 |
| 21.09.2023 | 0.019 | 0.019 | 0.019 |
| 20.09.2023 | 0.024 | 0.032 | 0.019 |
| 19.09.2023 | 0.028 | 0.032 | 0.025 |
© Bayerisches Landesamt für Umwelt 2024