
- Start >
- Rivers >
- Discharge >
- Bayern >
- Weiboldshausen >
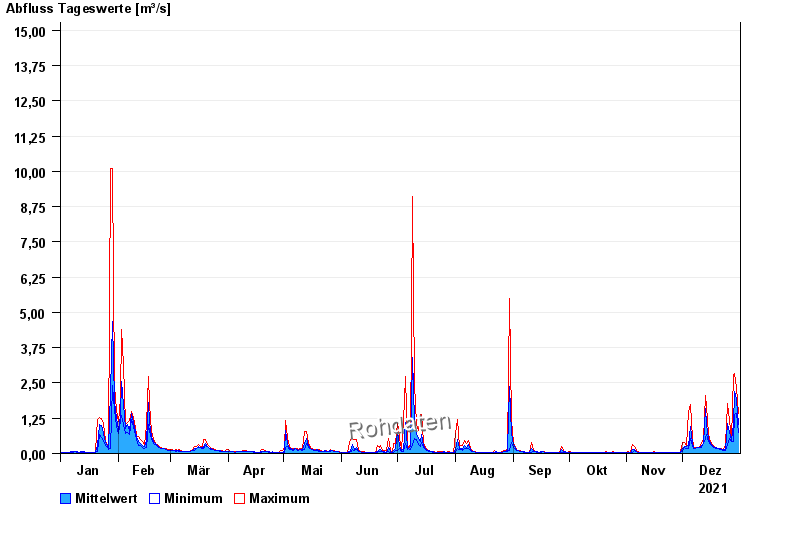
- Chart of year

Chart of year Weiboldshausen / Felchbach
Discharge from 01.01.2021 to 31.12.2021
note
Wasserstand und Abfluss wird zeitweise durch Biberdamm beeinflusst.
- 31.05.2013 Abfluss: 17 m³/s
- 21.12.1993 Abfluss: 15,5 m³/s
- 05.09.1987 Abfluss: 15,5 m³/s
- 15.02.1990 Abfluss: 15,3 m³/s
- 02.03.1987 Abfluss: 15,3 m³/s
| Date | Mean value [m³/s] | Maximum [m³/s] | Minimum [m³/s] |
|---|---|---|---|
| 31.12.2021 | 1.04 | 1.42 | 0.735 |
| 30.12.2021 | 1.91 | 2.35 | 1.42 |
| 29.12.2021 | 2.21 | 2.84 | 1.37 |
| 28.12.2021 | 1.03 | 2.77 | 0.42 |
| 27.12.2021 | 0.461 | 0.524 | 0.437 |
| 26.12.2021 | 0.752 | 1.16 | 0.524 |
| 25.12.2021 | 1.06 | 1.78 | 0.335 |
© Bayerisches Landesamt für Umwelt 2024